Immigrants from Eastern Africa vs Immigrants from Latvia Professional Degree
COMPARE
Immigrants from Eastern Africa
Immigrants from Latvia
Professional Degree
Professional Degree Comparison
Immigrants from Eastern Africa
Immigrants from Latvia
4.8%
PROFESSIONAL DEGREE
92.5/ 100
METRIC RATING
128th/ 347
METRIC RANK
5.8%
PROFESSIONAL DEGREE
100.0/ 100
METRIC RATING
49th/ 347
METRIC RANK
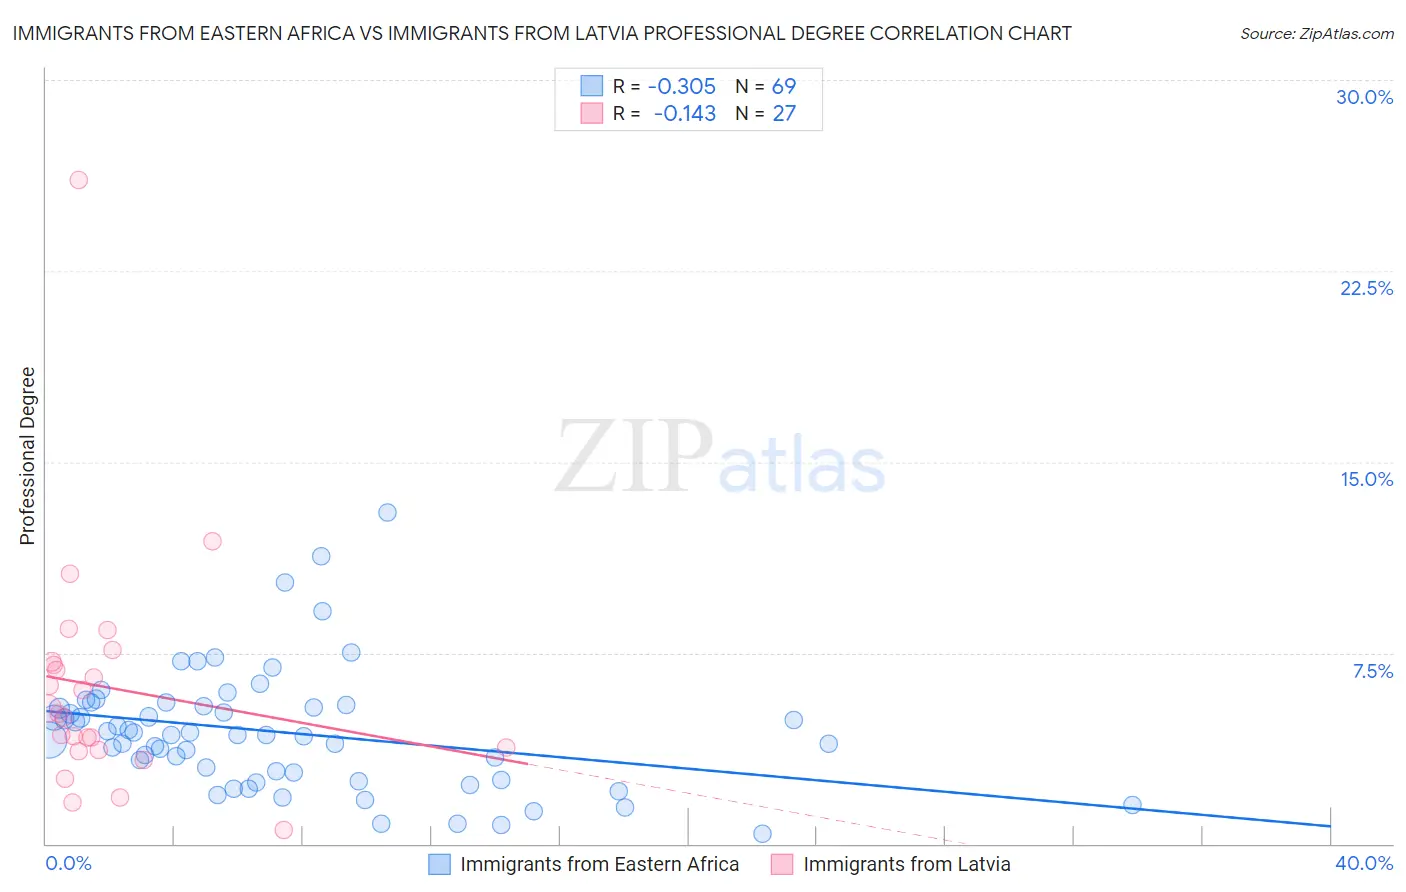
Immigrants from Eastern Africa vs Immigrants from Latvia Professional Degree Correlation Chart
The statistical analysis conducted on geographies consisting of 354,533,484 people shows a mild negative correlation between the proportion of Immigrants from Eastern Africa and percentage of population with at least professional degree education in the United States with a correlation coefficient (R) of -0.305 and weighted average of 4.8%. Similarly, the statistical analysis conducted on geographies consisting of 113,713,162 people shows a poor negative correlation between the proportion of Immigrants from Latvia and percentage of population with at least professional degree education in the United States with a correlation coefficient (R) of -0.143 and weighted average of 5.8%, a difference of 21.4%.
Professional Degree Correlation Summary
| Measurement | Immigrants from Eastern Africa | Immigrants from Latvia |
| Minimum | 0.40% | 0.54% |
| Maximum | 13.0% | 26.1% |
| Range | 12.6% | 25.5% |
| Mean | 4.4% | 6.1% |
| Median | 4.3% | 5.1% |
| Interquartile 25% (IQ1) | 2.7% | 3.7% |
| Interquartile 75% (IQ3) | 5.4% | 7.1% |
| Interquartile Range (IQR) | 2.8% | 3.4% |
| Standard Deviation (Sample) | 2.4% | 4.8% |
| Standard Deviation (Population) | 2.4% | 4.7% |
Similar Demographics by Professional Degree
Demographics Similar to Immigrants from Eastern Africa by Professional Degree
In terms of professional degree, the demographic groups most similar to Immigrants from Eastern Africa are Serbian (4.8%, a difference of 0.020%), European (4.8%, a difference of 0.32%), Immigrants from Albania (4.8%, a difference of 0.37%), Palestinian (4.8%, a difference of 0.46%), and Icelander (4.8%, a difference of 0.48%).
| Demographics | Rating | Rank | Professional Degree |
| Immigrants | Moldova | 94.8 /100 | #121 | Exceptional 4.9% |
| Immigrants | Germany | 94.1 /100 | #122 | Exceptional 4.9% |
| Immigrants | Venezuela | 93.8 /100 | #123 | Exceptional 4.8% |
| Immigrants | Eritrea | 93.5 /100 | #124 | Exceptional 4.8% |
| Immigrants | Albania | 93.3 /100 | #125 | Exceptional 4.8% |
| Europeans | 93.2 /100 | #126 | Exceptional 4.8% |
| Serbians | 92.6 /100 | #127 | Exceptional 4.8% |
| Immigrants | Eastern Africa | 92.5 /100 | #128 | Exceptional 4.8% |
| Palestinians | 91.5 /100 | #129 | Exceptional 4.8% |
| Icelanders | 91.5 /100 | #130 | Exceptional 4.8% |
| Immigrants | Nepal | 91.4 /100 | #131 | Exceptional 4.8% |
| Pakistanis | 90.9 /100 | #132 | Exceptional 4.8% |
| Italians | 90.2 /100 | #133 | Exceptional 4.8% |
| South American Indians | 89.9 /100 | #134 | Excellent 4.8% |
| Macedonians | 89.8 /100 | #135 | Excellent 4.8% |
Demographics Similar to Immigrants from Latvia by Professional Degree
In terms of professional degree, the demographic groups most similar to Immigrants from Latvia are Immigrants from Czechoslovakia (5.8%, a difference of 0.32%), Immigrants from Greece (5.8%, a difference of 0.38%), Paraguayan (5.9%, a difference of 0.40%), Immigrants from Serbia (5.8%, a difference of 0.45%), and Immigrants from Netherlands (5.8%, a difference of 0.68%).
| Demographics | Rating | Rank | Professional Degree |
| Estonians | 100.0 /100 | #42 | Exceptional 6.0% |
| Immigrants | Saudi Arabia | 100.0 /100 | #43 | Exceptional 5.9% |
| Argentineans | 100.0 /100 | #44 | Exceptional 5.9% |
| Immigrants | South Central Asia | 100.0 /100 | #45 | Exceptional 5.9% |
| Immigrants | Argentina | 100.0 /100 | #46 | Exceptional 5.9% |
| Australians | 100.0 /100 | #47 | Exceptional 5.9% |
| Paraguayans | 100.0 /100 | #48 | Exceptional 5.9% |
| Immigrants | Latvia | 100.0 /100 | #49 | Exceptional 5.8% |
| Immigrants | Czechoslovakia | 100.0 /100 | #50 | Exceptional 5.8% |
| Immigrants | Greece | 100.0 /100 | #51 | Exceptional 5.8% |
| Immigrants | Serbia | 100.0 /100 | #52 | Exceptional 5.8% |
| Immigrants | Netherlands | 100.0 /100 | #53 | Exceptional 5.8% |
| Immigrants | Kuwait | 100.0 /100 | #54 | Exceptional 5.7% |
| Immigrants | Western Europe | 100.0 /100 | #55 | Exceptional 5.7% |
| Immigrants | Malaysia | 100.0 /100 | #56 | Exceptional 5.7% |