Immigrants from Western Africa vs Yuman No Schooling Completed
COMPARE
Immigrants from Western Africa
Yuman
No Schooling Completed
No Schooling Completed Comparison
Immigrants from Western Africa
Yuman
2.6%
NO SCHOOLING COMPLETED
0.1/ 100
METRIC RATING
276th/ 347
METRIC RANK
2.5%
NO SCHOOLING COMPLETED
0.4/ 100
METRIC RATING
267th/ 347
METRIC RANK
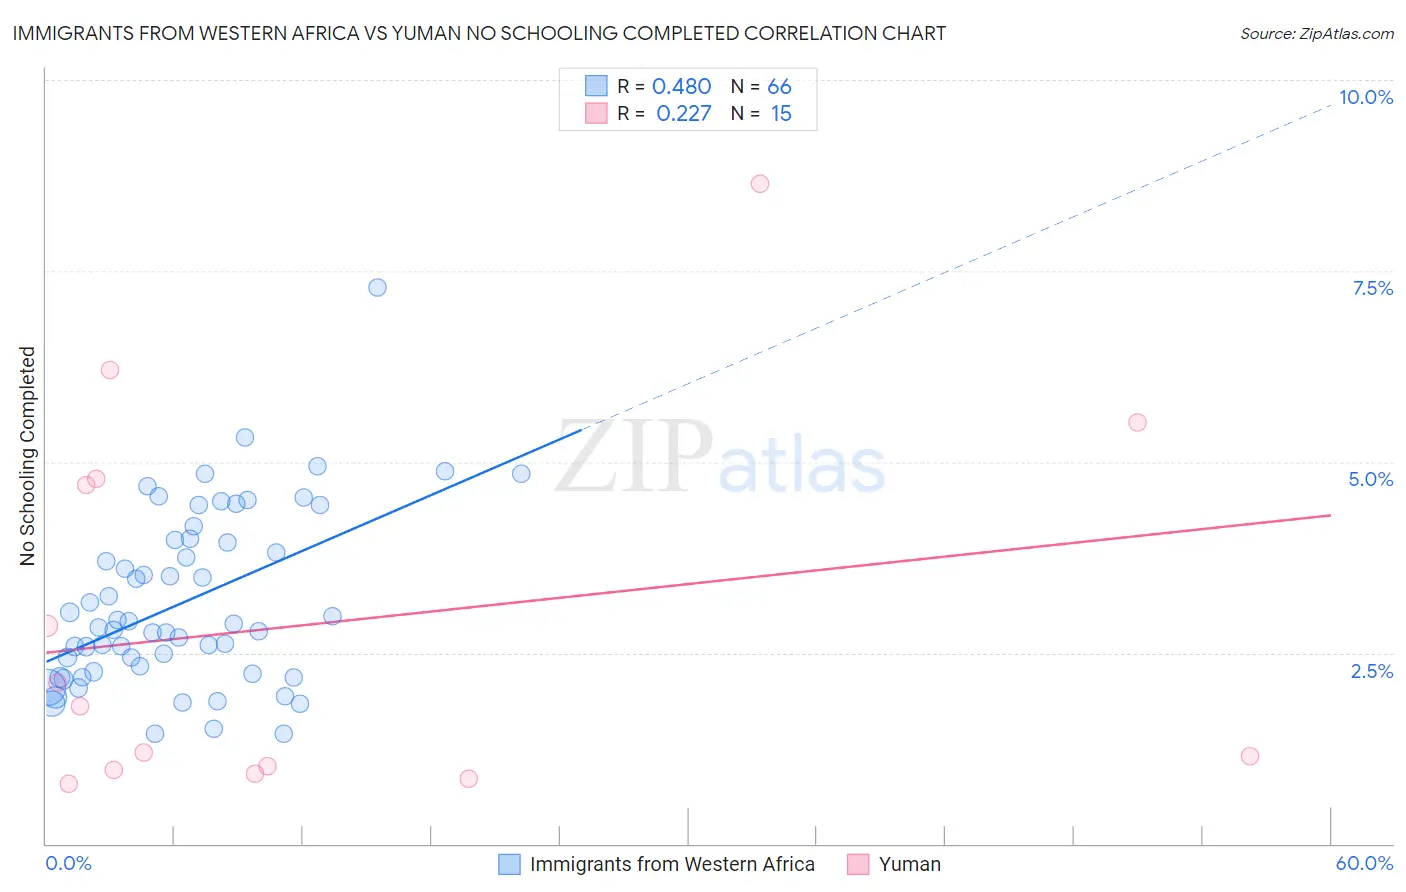
Immigrants from Western Africa vs Yuman No Schooling Completed Correlation Chart
The statistical analysis conducted on geographies consisting of 355,413,927 people shows a moderate positive correlation between the proportion of Immigrants from Western Africa and percentage of population with no schooling in the United States with a correlation coefficient (R) of 0.480 and weighted average of 2.6%. Similarly, the statistical analysis conducted on geographies consisting of 40,618,798 people shows a weak positive correlation between the proportion of Yuman and percentage of population with no schooling in the United States with a correlation coefficient (R) of 0.227 and weighted average of 2.5%, a difference of 3.7%.
No Schooling Completed Correlation Summary
| Measurement | Immigrants from Western Africa | Yuman |
| Minimum | 1.4% | 0.78% |
| Maximum | 7.3% | 8.6% |
| Range | 5.8% | 7.9% |
| Mean | 3.2% | 2.9% |
| Median | 2.9% | 1.8% |
| Interquartile 25% (IQ1) | 2.3% | 0.96% |
| Interquartile 75% (IQ3) | 4.0% | 4.8% |
| Interquartile Range (IQR) | 1.7% | 3.8% |
| Standard Deviation (Sample) | 1.1% | 2.5% |
| Standard Deviation (Population) | 1.1% | 2.4% |
Demographics Similar to Immigrants from Western Africa and Yuman by No Schooling Completed
In terms of no schooling completed, the demographic groups most similar to Immigrants from Western Africa are Immigrants from Philippines (2.6%, a difference of 0.050%), Immigrants from Uzbekistan (2.6%, a difference of 0.25%), Immigrants from China (2.6%, a difference of 0.56%), Ghanaian (2.6%, a difference of 0.74%), and Barbadian (2.6%, a difference of 0.80%). Similarly, the demographic groups most similar to Yuman are Fijian (2.5%, a difference of 0.17%), West Indian (2.5%, a difference of 0.25%), Taiwanese (2.5%, a difference of 0.26%), Indian (Asian) (2.5%, a difference of 0.43%), and Immigrants from Liberia (2.5%, a difference of 0.56%).
| Demographics | Rating | Rank | No Schooling Completed |
| Armenians | 0.5 /100 | #261 | Tragic 2.5% |
| Immigrants | Sierra Leone | 0.5 /100 | #262 | Tragic 2.5% |
| Immigrants | Liberia | 0.4 /100 | #263 | Tragic 2.5% |
| Indians (Asian) | 0.4 /100 | #264 | Tragic 2.5% |
| West Indians | 0.4 /100 | #265 | Tragic 2.5% |
| Fijians | 0.4 /100 | #266 | Tragic 2.5% |
| Yuman | 0.4 /100 | #267 | Tragic 2.5% |
| Taiwanese | 0.3 /100 | #268 | Tragic 2.5% |
| Immigrants | Nigeria | 0.2 /100 | #269 | Tragic 2.5% |
| Immigrants | Peru | 0.2 /100 | #270 | Tragic 2.5% |
| Cubans | 0.2 /100 | #271 | Tragic 2.5% |
| Immigrants | Bolivia | 0.2 /100 | #272 | Tragic 2.5% |
| Immigrants | Cameroon | 0.1 /100 | #273 | Tragic 2.5% |
| Ghanaians | 0.1 /100 | #274 | Tragic 2.6% |
| Immigrants | China | 0.1 /100 | #275 | Tragic 2.6% |
| Immigrants | Western Africa | 0.1 /100 | #276 | Tragic 2.6% |
| Immigrants | Philippines | 0.1 /100 | #277 | Tragic 2.6% |
| Immigrants | Uzbekistan | 0.1 /100 | #278 | Tragic 2.6% |
| Barbadians | 0.1 /100 | #279 | Tragic 2.6% |
| Trinidadians and Tobagonians | 0.1 /100 | #280 | Tragic 2.6% |
| Afghans | 0.1 /100 | #281 | Tragic 2.6% |