Basque vs Immigrants from Barbados No Schooling Completed
COMPARE
Basque
Immigrants from Barbados
No Schooling Completed
No Schooling Completed Comparison
Basques
Immigrants from Barbados
1.8%
NO SCHOOLING COMPLETED
97.9/ 100
METRIC RATING
103rd/ 347
METRIC RANK
2.7%
NO SCHOOLING COMPLETED
0.0/ 100
METRIC RATING
285th/ 347
METRIC RANK
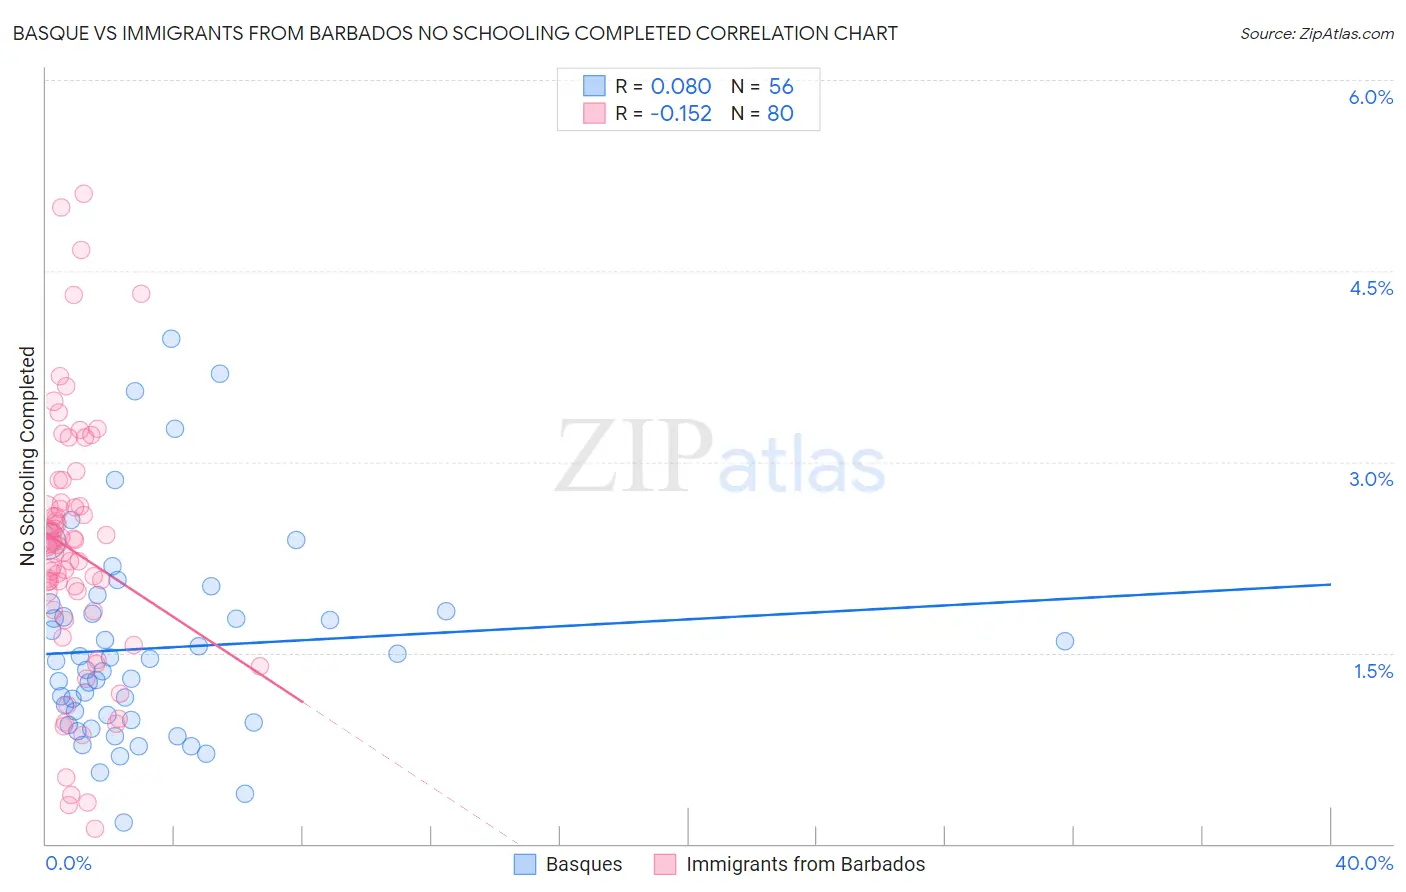
Basque vs Immigrants from Barbados No Schooling Completed Correlation Chart
The statistical analysis conducted on geographies consisting of 164,919,642 people shows a slight positive correlation between the proportion of Basques and percentage of population with no schooling in the United States with a correlation coefficient (R) of 0.080 and weighted average of 1.8%. Similarly, the statistical analysis conducted on geographies consisting of 112,603,347 people shows a poor negative correlation between the proportion of Immigrants from Barbados and percentage of population with no schooling in the United States with a correlation coefficient (R) of -0.152 and weighted average of 2.7%, a difference of 45.8%.
No Schooling Completed Correlation Summary
| Measurement | Basque | Immigrants from Barbados |
| Minimum | 0.17% | 0.12% |
| Maximum | 4.0% | 5.1% |
| Range | 3.8% | 5.0% |
| Mean | 1.5% | 2.3% |
| Median | 1.4% | 2.4% |
| Interquartile 25% (IQ1) | 0.96% | 1.8% |
| Interquartile 75% (IQ3) | 1.8% | 2.6% |
| Interquartile Range (IQR) | 0.85% | 0.82% |
| Standard Deviation (Sample) | 0.80% | 1.0% |
| Standard Deviation (Population) | 0.79% | 1.00% |
Similar Demographics by No Schooling Completed
Demographics Similar to Basques by No Schooling Completed
In terms of no schooling completed, the demographic groups most similar to Basques are Immigrants from Switzerland (1.8%, a difference of 0.050%), Immigrants from Czechoslovakia (1.8%, a difference of 0.060%), Immigrants from Singapore (1.8%, a difference of 0.35%), Choctaw (1.8%, a difference of 0.55%), and Thai (1.8%, a difference of 0.57%).
| Demographics | Rating | Rank | No Schooling Completed |
| Bhutanese | 98.4 /100 | #96 | Exceptional 1.8% |
| Immigrants | Ireland | 98.4 /100 | #97 | Exceptional 1.8% |
| Iranians | 98.2 /100 | #98 | Exceptional 1.8% |
| Choctaw | 98.1 /100 | #99 | Exceptional 1.8% |
| Immigrants | Singapore | 98.0 /100 | #100 | Exceptional 1.8% |
| Immigrants | Czechoslovakia | 97.9 /100 | #101 | Exceptional 1.8% |
| Immigrants | Switzerland | 97.9 /100 | #102 | Exceptional 1.8% |
| Basques | 97.9 /100 | #103 | Exceptional 1.8% |
| Thais | 97.5 /100 | #104 | Exceptional 1.8% |
| German Russians | 97.5 /100 | #105 | Exceptional 1.8% |
| Immigrants | France | 97.3 /100 | #106 | Exceptional 1.8% |
| Yugoslavians | 97.2 /100 | #107 | Exceptional 1.8% |
| Okinawans | 97.1 /100 | #108 | Exceptional 1.8% |
| Immigrants | Saudi Arabia | 96.8 /100 | #109 | Exceptional 1.9% |
| Immigrants | Latvia | 96.7 /100 | #110 | Exceptional 1.9% |
Demographics Similar to Immigrants from Barbados by No Schooling Completed
In terms of no schooling completed, the demographic groups most similar to Immigrants from Barbados are Immigrants from West Indies (2.7%, a difference of 0.070%), Immigrants from Portugal (2.7%, a difference of 0.42%), Immigrants from Trinidad and Tobago (2.6%, a difference of 0.80%), Immigrants from Afghanistan (2.7%, a difference of 1.2%), and Immigrants from St. Vincent and the Grenadines (2.7%, a difference of 1.3%).
| Demographics | Rating | Rank | No Schooling Completed |
| Immigrants | Uzbekistan | 0.1 /100 | #278 | Tragic 2.6% |
| Barbadians | 0.1 /100 | #279 | Tragic 2.6% |
| Trinidadians and Tobagonians | 0.1 /100 | #280 | Tragic 2.6% |
| Afghans | 0.1 /100 | #281 | Tragic 2.6% |
| Immigrants | Ghana | 0.1 /100 | #282 | Tragic 2.6% |
| Immigrants | Trinidad and Tobago | 0.0 /100 | #283 | Tragic 2.6% |
| Immigrants | West Indies | 0.0 /100 | #284 | Tragic 2.7% |
| Immigrants | Barbados | 0.0 /100 | #285 | Tragic 2.7% |
| Immigrants | Portugal | 0.0 /100 | #286 | Tragic 2.7% |
| Immigrants | Afghanistan | 0.0 /100 | #287 | Tragic 2.7% |
| Immigrants | St. Vincent and the Grenadines | 0.0 /100 | #288 | Tragic 2.7% |
| Immigrants | Thailand | 0.0 /100 | #289 | Tragic 2.7% |
| Immigrants | Hong Kong | 0.0 /100 | #290 | Tragic 2.7% |
| British West Indians | 0.0 /100 | #291 | Tragic 2.7% |
| Immigrants | Grenada | 0.0 /100 | #292 | Tragic 2.8% |