Immigrants from Cameroon vs Iroquois College, Under 1 year
COMPARE
Immigrants from Cameroon
Iroquois
College, Under 1 year
College, Under 1 year Comparison
Immigrants from Cameroon
Iroquois
64.6%
COLLEGE, UNDER 1 YEAR
24.6/ 100
METRIC RATING
194th/ 347
METRIC RANK
62.6%
COLLEGE, UNDER 1 YEAR
2.0/ 100
METRIC RATING
233rd/ 347
METRIC RANK
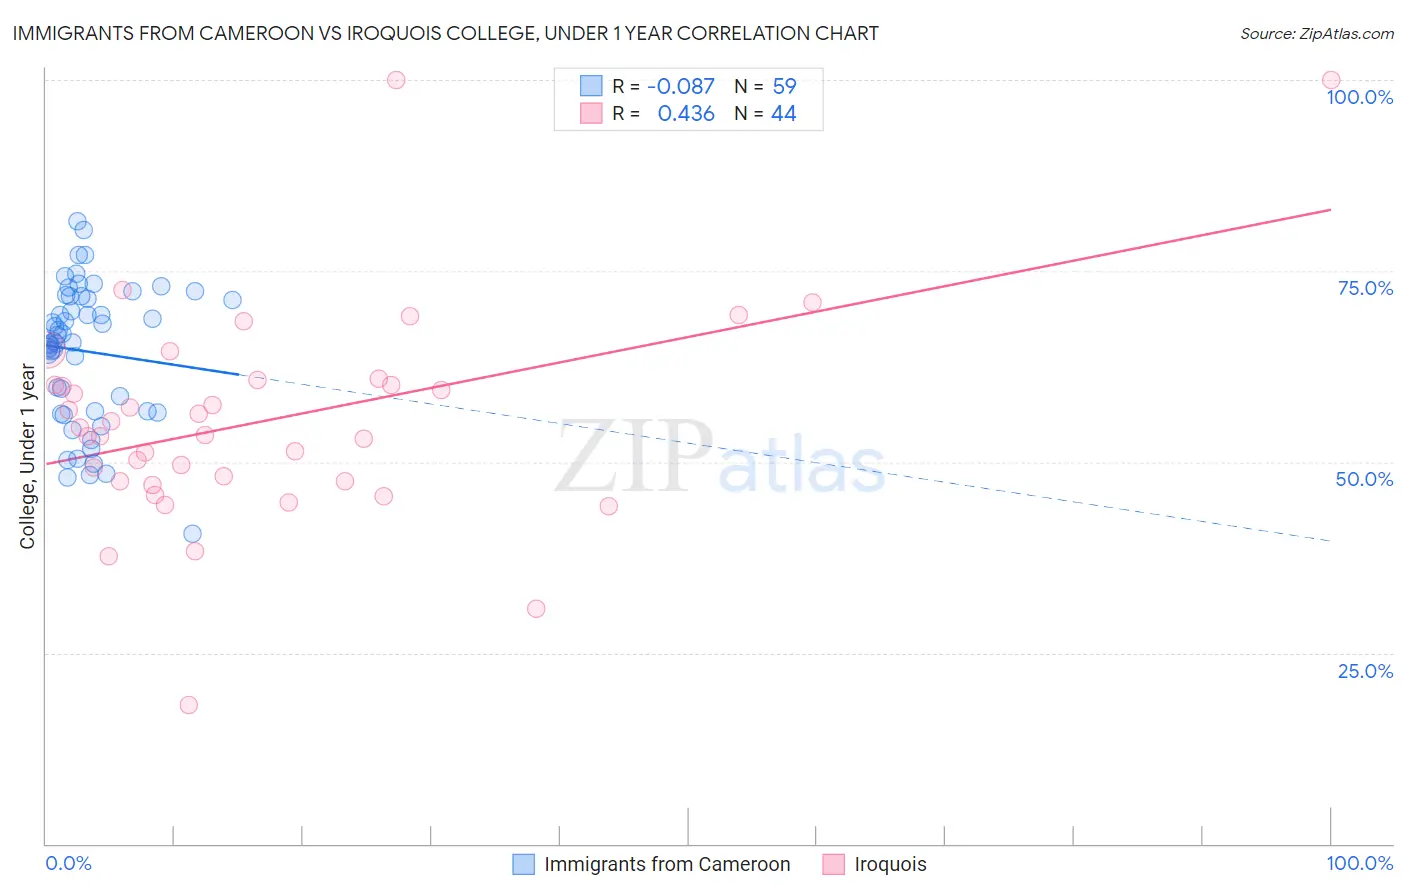
Immigrants from Cameroon vs Iroquois College, Under 1 year Correlation Chart
The statistical analysis conducted on geographies consisting of 130,767,721 people shows a slight negative correlation between the proportion of Immigrants from Cameroon and percentage of population with at least college, under 1 year education in the United States with a correlation coefficient (R) of -0.087 and weighted average of 64.6%. Similarly, the statistical analysis conducted on geographies consisting of 207,308,653 people shows a moderate positive correlation between the proportion of Iroquois and percentage of population with at least college, under 1 year education in the United States with a correlation coefficient (R) of 0.436 and weighted average of 62.6%, a difference of 3.2%.
College, Under 1 year Correlation Summary
| Measurement | Immigrants from Cameroon | Iroquois |
| Minimum | 40.6% | 18.2% |
| Maximum | 81.6% | 100.0% |
| Range | 41.0% | 81.8% |
| Mean | 64.5% | 55.5% |
| Median | 65.7% | 54.0% |
| Interquartile 25% (IQ1) | 56.5% | 47.4% |
| Interquartile 75% (IQ3) | 71.7% | 60.4% |
| Interquartile Range (IQR) | 15.2% | 13.0% |
| Standard Deviation (Sample) | 9.1% | 14.4% |
| Standard Deviation (Population) | 9.0% | 14.3% |
Similar Demographics by College, Under 1 year
Demographics Similar to Immigrants from Cameroon by College, Under 1 year
In terms of college, under 1 year, the demographic groups most similar to Immigrants from Cameroon are Slovak (64.7%, a difference of 0.13%), Immigrants from Thailand (64.7%, a difference of 0.14%), Immigrants from South Eastern Asia (64.5%, a difference of 0.16%), Immigrants from Armenia (64.7%, a difference of 0.20%), and Tongan (64.5%, a difference of 0.21%).
| Demographics | Rating | Rank | College, Under 1 year |
| Immigrants | Southern Europe | 34.3 /100 | #187 | Fair 64.9% |
| Immigrants | Albania | 32.0 /100 | #188 | Fair 64.9% |
| Spanish | 31.6 /100 | #189 | Fair 64.9% |
| Immigrants | Philippines | 30.1 /100 | #190 | Fair 64.8% |
| Immigrants | Armenia | 28.1 /100 | #191 | Fair 64.7% |
| Immigrants | Thailand | 27.0 /100 | #192 | Fair 64.7% |
| Slovaks | 26.7 /100 | #193 | Fair 64.7% |
| Immigrants | Cameroon | 24.6 /100 | #194 | Fair 64.6% |
| Immigrants | South Eastern Asia | 22.1 /100 | #195 | Fair 64.5% |
| Tongans | 21.2 /100 | #196 | Fair 64.5% |
| Costa Ricans | 19.6 /100 | #197 | Poor 64.4% |
| Tsimshian | 17.9 /100 | #198 | Poor 64.3% |
| Panamanians | 17.0 /100 | #199 | Poor 64.3% |
| Nigerians | 16.7 /100 | #200 | Poor 64.3% |
| French Canadians | 16.3 /100 | #201 | Poor 64.2% |
Demographics Similar to Iroquois by College, Under 1 year
In terms of college, under 1 year, the demographic groups most similar to Iroquois are Chippewa (62.6%, a difference of 0.030%), Spanish American (62.6%, a difference of 0.080%), Osage (62.7%, a difference of 0.12%), Immigrants (62.5%, a difference of 0.21%), and Immigrants from Western Africa (62.8%, a difference of 0.22%).
| Demographics | Rating | Rank | College, Under 1 year |
| Immigrants | Colombia | 4.0 /100 | #226 | Tragic 63.1% |
| Immigrants | Ghana | 3.7 /100 | #227 | Tragic 63.1% |
| Samoans | 3.3 /100 | #228 | Tragic 63.0% |
| Liberians | 3.2 /100 | #229 | Tragic 63.0% |
| Immigrants | Nonimmigrants | 3.0 /100 | #230 | Tragic 62.9% |
| Immigrants | Western Africa | 2.4 /100 | #231 | Tragic 62.8% |
| Osage | 2.2 /100 | #232 | Tragic 62.7% |
| Iroquois | 2.0 /100 | #233 | Tragic 62.6% |
| Chippewa | 2.0 /100 | #234 | Tragic 62.6% |
| Spanish Americans | 1.9 /100 | #235 | Tragic 62.6% |
| Immigrants | Immigrants | 1.7 /100 | #236 | Tragic 62.5% |
| Immigrants | Burma/Myanmar | 1.6 /100 | #237 | Tragic 62.5% |
| French American Indians | 1.5 /100 | #238 | Tragic 62.4% |
| Nepalese | 1.1 /100 | #239 | Tragic 62.2% |
| Aleuts | 1.1 /100 | #240 | Tragic 62.2% |