Basque vs Immigrants from Uganda Unemployment Among Ages 30 to 34 years
COMPARE
Basque
Immigrants from Uganda
Unemployment Among Ages 30 to 34 years
Unemployment Among Ages 30 to 34 years Comparison
Basques
Immigrants from Uganda
5.4%
UNEMPLOYMENT AMONG AGES 30 TO 34 YEARS
57.3/ 100
METRIC RATING
164th/ 347
METRIC RANK
5.2%
UNEMPLOYMENT AMONG AGES 30 TO 34 YEARS
94.0/ 100
METRIC RATING
84th/ 347
METRIC RANK
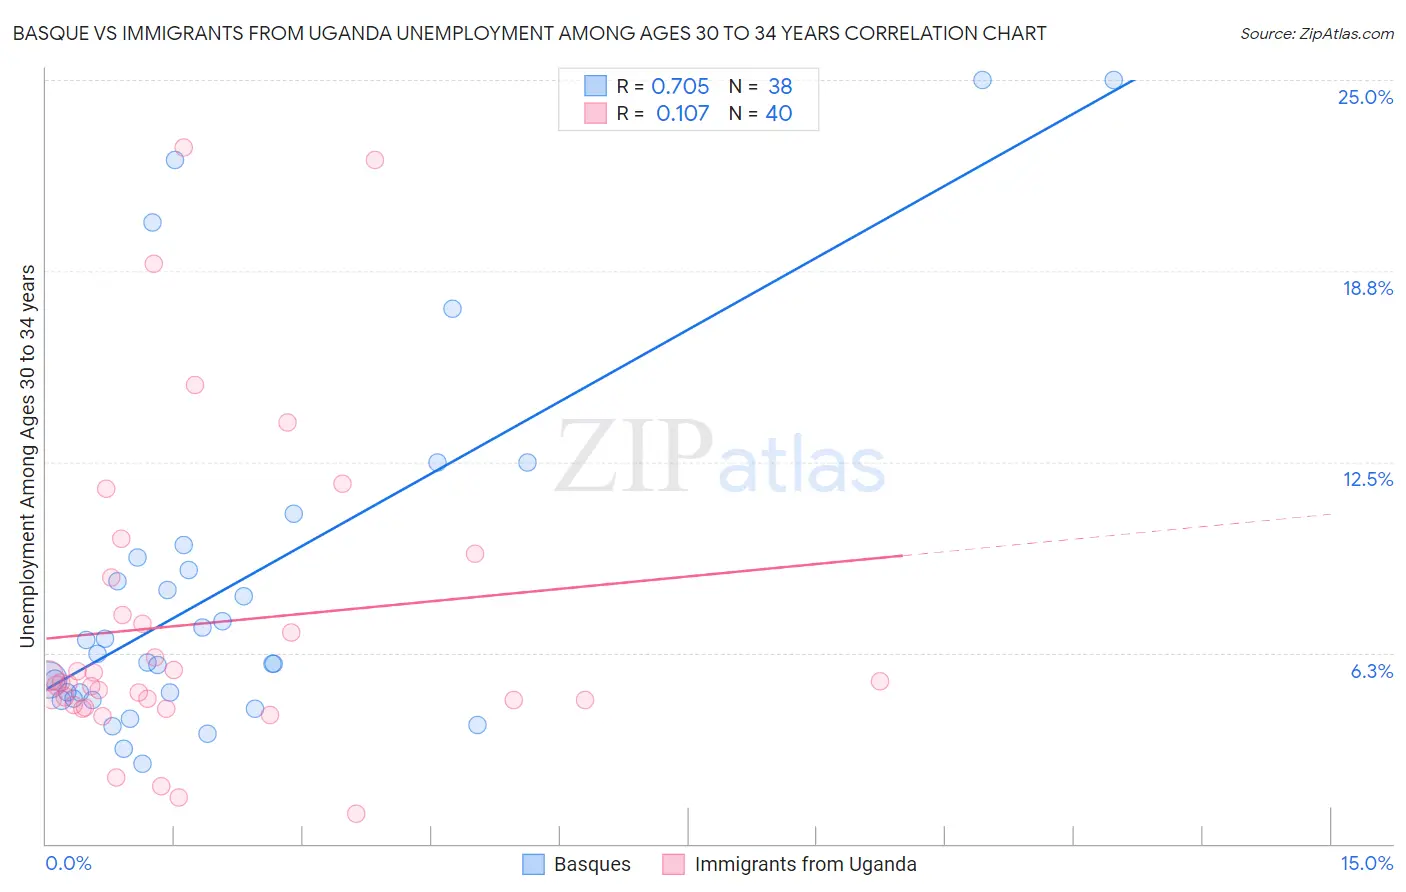
Basque vs Immigrants from Uganda Unemployment Among Ages 30 to 34 years Correlation Chart
The statistical analysis conducted on geographies consisting of 161,903,537 people shows a strong positive correlation between the proportion of Basques and unemployment rate among population between the ages 30 and 34 in the United States with a correlation coefficient (R) of 0.705 and weighted average of 5.4%. Similarly, the statistical analysis conducted on geographies consisting of 124,007,931 people shows a poor positive correlation between the proportion of Immigrants from Uganda and unemployment rate among population between the ages 30 and 34 in the United States with a correlation coefficient (R) of 0.107 and weighted average of 5.2%, a difference of 4.5%.
Unemployment Among Ages 30 to 34 years Correlation Summary
| Measurement | Basque | Immigrants from Uganda |
| Minimum | 2.6% | 1.0% |
| Maximum | 25.0% | 22.8% |
| Range | 22.4% | 21.8% |
| Mean | 8.5% | 7.2% |
| Median | 6.1% | 5.3% |
| Interquartile 25% (IQ1) | 4.8% | 4.6% |
| Interquartile 75% (IQ3) | 9.4% | 8.1% |
| Interquartile Range (IQR) | 4.6% | 3.5% |
| Standard Deviation (Sample) | 5.9% | 5.1% |
| Standard Deviation (Population) | 5.9% | 5.0% |
Similar Demographics by Unemployment Among Ages 30 to 34 years
Demographics Similar to Basques by Unemployment Among Ages 30 to 34 years
In terms of unemployment among ages 30 to 34 years, the demographic groups most similar to Basques are Arab (5.4%, a difference of 0.020%), Brazilian (5.4%, a difference of 0.060%), Welsh (5.4%, a difference of 0.070%), Austrian (5.4%, a difference of 0.12%), and Immigrants from Thailand (5.4%, a difference of 0.12%).
| Demographics | Rating | Rank | Unemployment Among Ages 30 to 34 years |
| Albanians | 63.7 /100 | #157 | Good 5.4% |
| Immigrants | Belarus | 62.7 /100 | #158 | Good 5.4% |
| Immigrants | Croatia | 61.0 /100 | #159 | Good 5.4% |
| Immigrants | Scotland | 59.3 /100 | #160 | Average 5.4% |
| Austrians | 59.0 /100 | #161 | Average 5.4% |
| Brazilians | 58.2 /100 | #162 | Average 5.4% |
| Arabs | 57.7 /100 | #163 | Average 5.4% |
| Basques | 57.3 /100 | #164 | Average 5.4% |
| Welsh | 56.3 /100 | #165 | Average 5.4% |
| Immigrants | Thailand | 55.6 /100 | #166 | Average 5.4% |
| English | 54.8 /100 | #167 | Average 5.4% |
| South Americans | 52.9 /100 | #168 | Average 5.4% |
| Immigrants | Israel | 52.9 /100 | #169 | Average 5.4% |
| Dutch | 52.6 /100 | #170 | Average 5.5% |
| Scottish | 51.8 /100 | #171 | Average 5.5% |
Demographics Similar to Immigrants from Uganda by Unemployment Among Ages 30 to 34 years
In terms of unemployment among ages 30 to 34 years, the demographic groups most similar to Immigrants from Uganda are Immigrants from Egypt (5.2%, a difference of 0.030%), Immigrants from Korea (5.2%, a difference of 0.050%), Immigrants from Latvia (5.2%, a difference of 0.080%), Immigrants from Australia (5.2%, a difference of 0.14%), and Bhutanese (5.2%, a difference of 0.15%).
| Demographics | Rating | Rank | Unemployment Among Ages 30 to 34 years |
| Uruguayans | 95.4 /100 | #77 | Exceptional 5.2% |
| Indonesians | 95.1 /100 | #78 | Exceptional 5.2% |
| Immigrants | Lithuania | 95.0 /100 | #79 | Exceptional 5.2% |
| Immigrants | Indonesia | 94.7 /100 | #80 | Exceptional 5.2% |
| Chileans | 94.4 /100 | #81 | Exceptional 5.2% |
| Immigrants | Latvia | 94.2 /100 | #82 | Exceptional 5.2% |
| Immigrants | Korea | 94.1 /100 | #83 | Exceptional 5.2% |
| Immigrants | Uganda | 94.0 /100 | #84 | Exceptional 5.2% |
| Immigrants | Egypt | 93.9 /100 | #85 | Exceptional 5.2% |
| Immigrants | Australia | 93.5 /100 | #86 | Exceptional 5.2% |
| Bhutanese | 93.5 /100 | #87 | Exceptional 5.2% |
| Immigrants | Kenya | 93.3 /100 | #88 | Exceptional 5.2% |
| Immigrants | Sweden | 93.3 /100 | #89 | Exceptional 5.2% |
| Immigrants | Romania | 92.8 /100 | #90 | Exceptional 5.2% |
| Iraqis | 92.6 /100 | #91 | Exceptional 5.2% |