Yakama vs Immigrants from Philippines Professional Degree
COMPARE
Yakama
Immigrants from Philippines
Professional Degree
Professional Degree Comparison
Yakama
Immigrants from Philippines
3.1%
PROFESSIONAL DEGREE
0.0/ 100
METRIC RATING
332nd/ 347
METRIC RANK
3.9%
PROFESSIONAL DEGREE
4.1/ 100
METRIC RATING
233rd/ 347
METRIC RANK
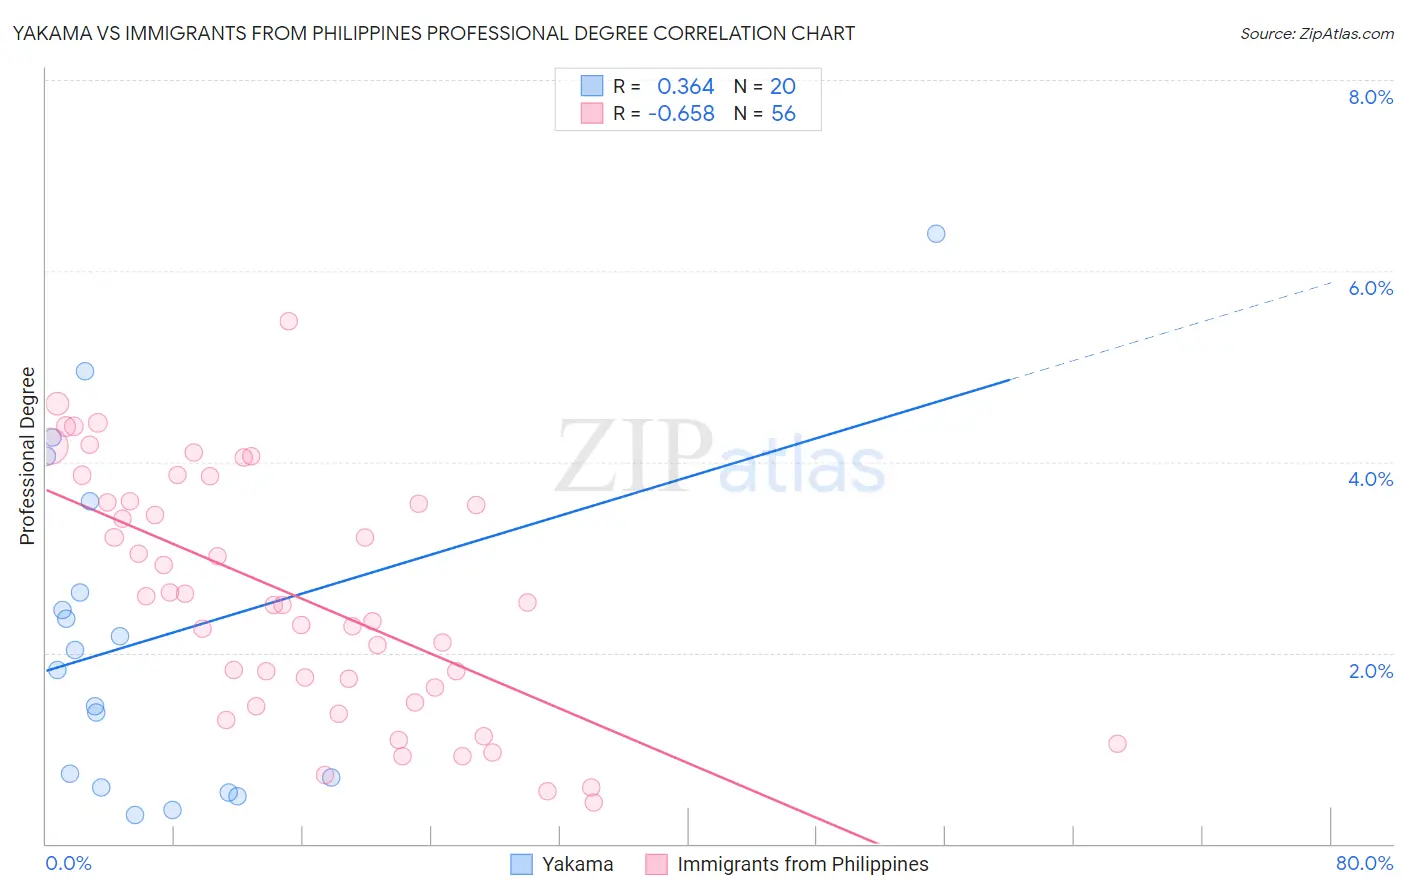
Yakama vs Immigrants from Philippines Professional Degree Correlation Chart
The statistical analysis conducted on geographies consisting of 19,874,339 people shows a mild positive correlation between the proportion of Yakama and percentage of population with at least professional degree education in the United States with a correlation coefficient (R) of 0.364 and weighted average of 3.1%. Similarly, the statistical analysis conducted on geographies consisting of 469,653,358 people shows a significant negative correlation between the proportion of Immigrants from Philippines and percentage of population with at least professional degree education in the United States with a correlation coefficient (R) of -0.658 and weighted average of 3.9%, a difference of 26.7%.
Professional Degree Correlation Summary
| Measurement | Yakama | Immigrants from Philippines |
| Minimum | 0.31% | 0.44% |
| Maximum | 6.4% | 5.5% |
| Range | 6.1% | 5.0% |
| Mean | 2.2% | 2.6% |
| Median | 1.9% | 2.5% |
| Interquartile 25% (IQ1) | 0.64% | 1.6% |
| Interquartile 75% (IQ3) | 3.1% | 3.6% |
| Interquartile Range (IQR) | 2.5% | 2.0% |
| Standard Deviation (Sample) | 1.7% | 1.3% |
| Standard Deviation (Population) | 1.7% | 1.2% |
Similar Demographics by Professional Degree
Demographics Similar to Yakama by Professional Degree
In terms of professional degree, the demographic groups most similar to Yakama are Puget Sound Salish (3.1%, a difference of 0.030%), Kiowa (3.1%, a difference of 0.11%), Immigrants from Cabo Verde (3.1%, a difference of 0.23%), Bangladeshi (3.1%, a difference of 0.31%), and Creek (3.1%, a difference of 0.52%).
| Demographics | Rating | Rank | Professional Degree |
| Yaqui | 0.0 /100 | #325 | Tragic 3.2% |
| Menominee | 0.0 /100 | #326 | Tragic 3.1% |
| Dutch West Indians | 0.0 /100 | #327 | Tragic 3.1% |
| Creek | 0.0 /100 | #328 | Tragic 3.1% |
| Bangladeshis | 0.0 /100 | #329 | Tragic 3.1% |
| Immigrants | Cabo Verde | 0.0 /100 | #330 | Tragic 3.1% |
| Kiowa | 0.0 /100 | #331 | Tragic 3.1% |
| Yakama | 0.0 /100 | #332 | Tragic 3.1% |
| Puget Sound Salish | 0.0 /100 | #333 | Tragic 3.1% |
| Pennsylvania Germans | 0.0 /100 | #334 | Tragic 3.0% |
| Natives/Alaskans | 0.0 /100 | #335 | Tragic 3.0% |
| Fijians | 0.0 /100 | #336 | Tragic 2.9% |
| Arapaho | 0.0 /100 | #337 | Tragic 2.9% |
| Navajo | 0.0 /100 | #338 | Tragic 2.9% |
| Immigrants | Central America | 0.0 /100 | #339 | Tragic 2.9% |
Demographics Similar to Immigrants from Philippines by Professional Degree
In terms of professional degree, the demographic groups most similar to Immigrants from Philippines are Nonimmigrants (3.9%, a difference of 0.050%), Immigrants from Barbados (3.9%, a difference of 0.050%), Cree (3.9%, a difference of 0.26%), Spanish American (3.9%, a difference of 0.28%), and Immigrants from Trinidad and Tobago (3.9%, a difference of 0.34%).
| Demographics | Rating | Rank | Professional Degree |
| German Russians | 6.1 /100 | #226 | Tragic 4.0% |
| Cubans | 5.9 /100 | #227 | Tragic 4.0% |
| Immigrants | West Indies | 5.6 /100 | #228 | Tragic 4.0% |
| Immigrants | Burma/Myanmar | 5.4 /100 | #229 | Tragic 3.9% |
| Nicaraguans | 5.1 /100 | #230 | Tragic 3.9% |
| Ecuadorians | 4.6 /100 | #231 | Tragic 3.9% |
| Cree | 4.3 /100 | #232 | Tragic 3.9% |
| Immigrants | Philippines | 4.1 /100 | #233 | Tragic 3.9% |
| Immigrants | Nonimmigrants | 4.0 /100 | #234 | Tragic 3.9% |
| Immigrants | Barbados | 4.0 /100 | #235 | Tragic 3.9% |
| Spanish Americans | 3.8 /100 | #236 | Tragic 3.9% |
| Immigrants | Trinidad and Tobago | 3.8 /100 | #237 | Tragic 3.9% |
| Colville | 2.6 /100 | #238 | Tragic 3.8% |
| British West Indians | 2.4 /100 | #239 | Tragic 3.8% |
| Immigrants | Ecuador | 2.3 /100 | #240 | Tragic 3.8% |