Salvadoran vs Immigrants from Indonesia 11th Grade
COMPARE
Salvadoran
Immigrants from Indonesia
11th Grade
11th Grade Comparison
Salvadorans
Immigrants from Indonesia
86.2%
11TH GRADE
0.0/ 100
METRIC RATING
340th/ 347
METRIC RANK
92.4%
11TH GRADE
33.7/ 100
METRIC RATING
188th/ 347
METRIC RANK
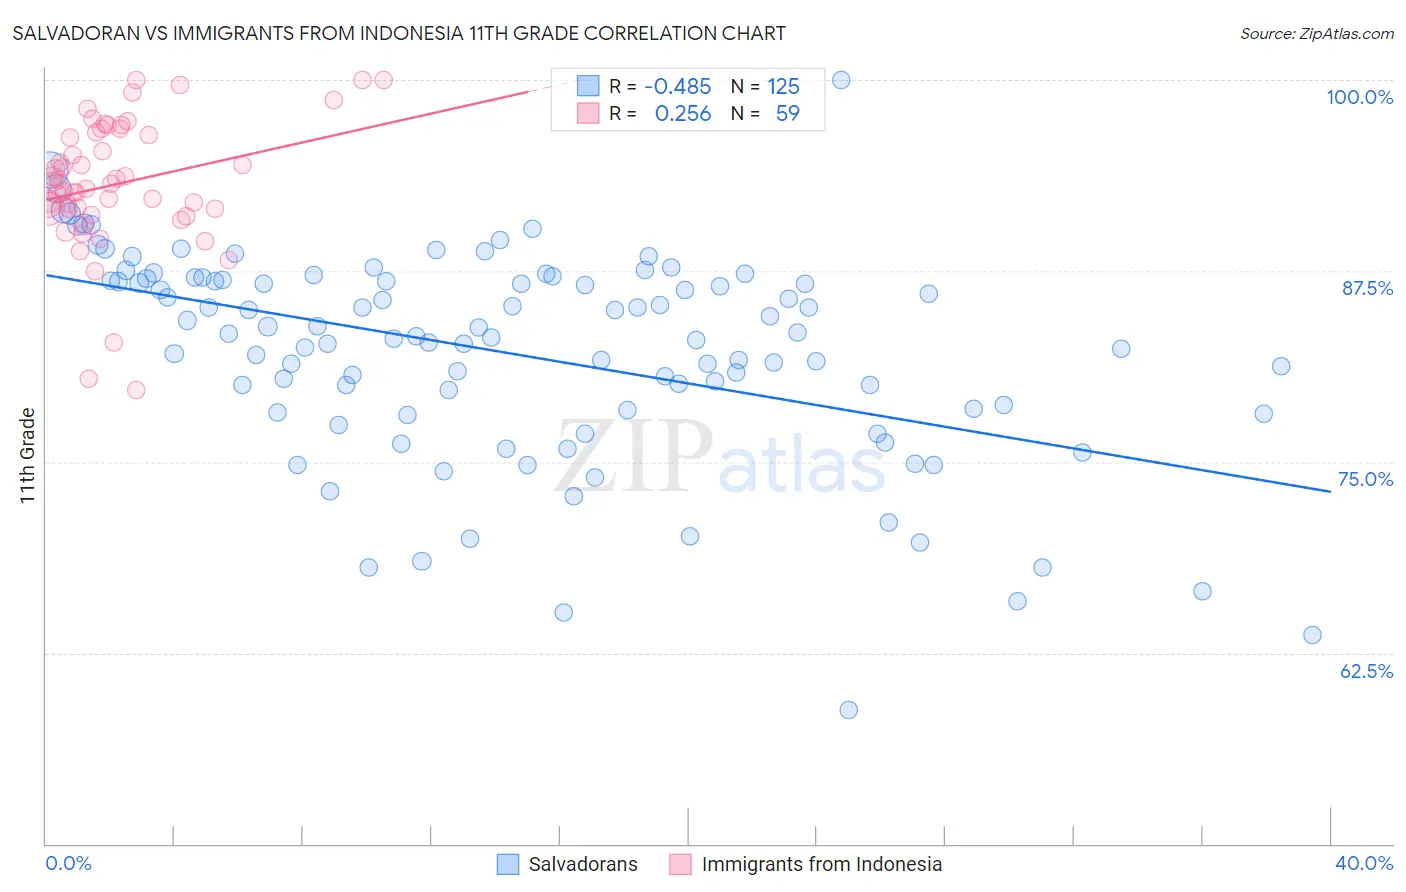
Salvadoran vs Immigrants from Indonesia 11th Grade Correlation Chart
The statistical analysis conducted on geographies consisting of 399,020,036 people shows a moderate negative correlation between the proportion of Salvadorans and percentage of population with at least 11th grade education in the United States with a correlation coefficient (R) of -0.485 and weighted average of 86.2%. Similarly, the statistical analysis conducted on geographies consisting of 215,778,424 people shows a weak positive correlation between the proportion of Immigrants from Indonesia and percentage of population with at least 11th grade education in the United States with a correlation coefficient (R) of 0.256 and weighted average of 92.4%, a difference of 7.2%.
11th Grade Correlation Summary
| Measurement | Salvadoran | Immigrants from Indonesia |
| Minimum | 58.8% | 79.7% |
| Maximum | 100.0% | 100.0% |
| Range | 41.2% | 20.3% |
| Mean | 82.1% | 93.2% |
| Median | 83.2% | 93.2% |
| Interquartile 25% (IQ1) | 78.3% | 91.5% |
| Interquartile 75% (IQ3) | 86.9% | 96.6% |
| Interquartile Range (IQR) | 8.6% | 5.1% |
| Standard Deviation (Sample) | 6.9% | 4.2% |
| Standard Deviation (Population) | 6.9% | 4.2% |
Similar Demographics by 11th Grade
Demographics Similar to Salvadorans by 11th Grade
In terms of 11th grade, the demographic groups most similar to Salvadorans are Mexican (86.1%, a difference of 0.060%), Guatemalan (86.4%, a difference of 0.23%), Immigrants from Guatemala (85.8%, a difference of 0.39%), Immigrants from Latin America (86.8%, a difference of 0.73%), and Immigrants from Dominican Republic (86.9%, a difference of 0.85%).
| Demographics | Rating | Rank | 11th Grade |
| Immigrants | Yemen | 0.0 /100 | #333 | Tragic 87.1% |
| Houma | 0.0 /100 | #334 | Tragic 87.0% |
| Central Americans | 0.0 /100 | #335 | Tragic 86.9% |
| Immigrants | Dominican Republic | 0.0 /100 | #336 | Tragic 86.9% |
| Immigrants | Honduras | 0.0 /100 | #337 | Tragic 86.9% |
| Immigrants | Latin America | 0.0 /100 | #338 | Tragic 86.8% |
| Guatemalans | 0.0 /100 | #339 | Tragic 86.4% |
| Salvadorans | 0.0 /100 | #340 | Tragic 86.2% |
| Mexicans | 0.0 /100 | #341 | Tragic 86.1% |
| Immigrants | Guatemala | 0.0 /100 | #342 | Tragic 85.8% |
| Immigrants | El Salvador | 0.0 /100 | #343 | Tragic 85.3% |
| Yakama | 0.0 /100 | #344 | Tragic 85.0% |
| Immigrants | Central America | 0.0 /100 | #345 | Tragic 84.9% |
| Spanish American Indians | 0.0 /100 | #346 | Tragic 84.7% |
| Immigrants | Mexico | 0.0 /100 | #347 | Tragic 84.5% |
Demographics Similar to Immigrants from Indonesia by 11th Grade
In terms of 11th grade, the demographic groups most similar to Immigrants from Indonesia are Immigrants from Chile (92.4%, a difference of 0.0%), Immigrants from Western Asia (92.4%, a difference of 0.010%), Arapaho (92.4%, a difference of 0.020%), Immigrants from Nepal (92.4%, a difference of 0.030%), and Chickasaw (92.3%, a difference of 0.030%).
| Demographics | Rating | Rank | 11th Grade |
| Cherokee | 40.7 /100 | #181 | Average 92.4% |
| Immigrants | Morocco | 38.6 /100 | #182 | Fair 92.4% |
| Immigrants | Malaysia | 37.6 /100 | #183 | Fair 92.4% |
| Immigrants | Asia | 37.4 /100 | #184 | Fair 92.4% |
| Immigrants | Nepal | 36.4 /100 | #185 | Fair 92.4% |
| Arapaho | 35.1 /100 | #186 | Fair 92.4% |
| Immigrants | Western Asia | 35.0 /100 | #187 | Fair 92.4% |
| Immigrants | Indonesia | 33.7 /100 | #188 | Fair 92.4% |
| Immigrants | Chile | 33.3 /100 | #189 | Fair 92.4% |
| Chickasaw | 31.4 /100 | #190 | Fair 92.3% |
| French American Indians | 30.8 /100 | #191 | Fair 92.3% |
| Immigrants | Syria | 30.4 /100 | #192 | Fair 92.3% |
| Moroccans | 28.7 /100 | #193 | Fair 92.3% |
| Sioux | 28.5 /100 | #194 | Fair 92.3% |
| Liberians | 26.8 /100 | #195 | Fair 92.3% |