Barbadian vs Immigrants from Northern Africa Bachelor's Degree
COMPARE
Barbadian
Immigrants from Northern Africa
Bachelor's Degree
Bachelor's Degree Comparison
Barbadians
Immigrants from Northern Africa
36.1%
BACHELOR'S DEGREE
13.5/ 100
METRIC RATING
216th/ 347
METRIC RANK
41.9%
BACHELOR'S DEGREE
98.9/ 100
METRIC RATING
91st/ 347
METRIC RANK
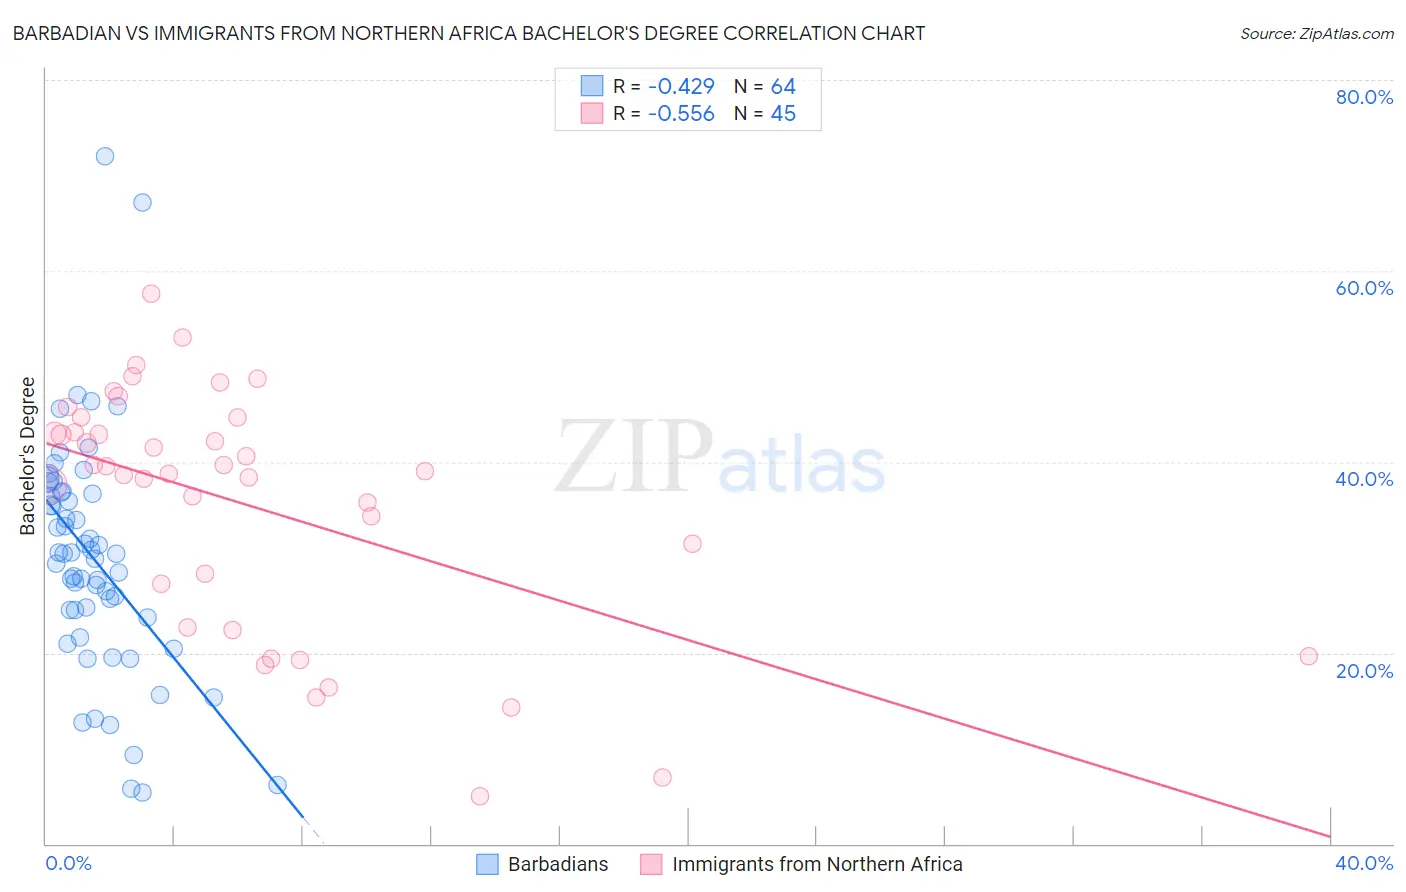
Barbadian vs Immigrants from Northern Africa Bachelor's Degree Correlation Chart
The statistical analysis conducted on geographies consisting of 141,300,746 people shows a moderate negative correlation between the proportion of Barbadians and percentage of population with at least bachelor's degree education in the United States with a correlation coefficient (R) of -0.429 and weighted average of 36.1%. Similarly, the statistical analysis conducted on geographies consisting of 321,192,912 people shows a substantial negative correlation between the proportion of Immigrants from Northern Africa and percentage of population with at least bachelor's degree education in the United States with a correlation coefficient (R) of -0.556 and weighted average of 41.9%, a difference of 16.1%.
Bachelor's Degree Correlation Summary
| Measurement | Barbadian | Immigrants from Northern Africa |
| Minimum | 5.4% | 5.0% |
| Maximum | 72.0% | 57.6% |
| Range | 66.6% | 52.6% |
| Mean | 30.0% | 35.5% |
| Median | 30.3% | 39.1% |
| Interquartile 25% (IQ1) | 24.1% | 24.9% |
| Interquartile 75% (IQ3) | 36.8% | 43.8% |
| Interquartile Range (IQR) | 12.7% | 18.9% |
| Standard Deviation (Sample) | 12.3% | 12.7% |
| Standard Deviation (Population) | 12.2% | 12.5% |
Similar Demographics by Bachelor's Degree
Demographics Similar to Barbadians by Bachelor's Degree
In terms of bachelor's degree, the demographic groups most similar to Barbadians are Immigrants from Western Africa (36.1%, a difference of 0.060%), German (36.1%, a difference of 0.090%), Immigrants from Panama (36.2%, a difference of 0.16%), German Russian (35.8%, a difference of 0.81%), and Immigrants from Philippines (36.4%, a difference of 0.84%).
| Demographics | Rating | Rank | Bachelor's Degree |
| Panamanians | 18.8 /100 | #209 | Poor 36.5% |
| French | 18.6 /100 | #210 | Poor 36.5% |
| Scotch-Irish | 18.3 /100 | #211 | Poor 36.4% |
| Immigrants | Philippines | 17.8 /100 | #212 | Poor 36.4% |
| Immigrants | Panama | 14.2 /100 | #213 | Poor 36.2% |
| Germans | 13.9 /100 | #214 | Poor 36.1% |
| Immigrants | Western Africa | 13.8 /100 | #215 | Poor 36.1% |
| Barbadians | 13.5 /100 | #216 | Poor 36.1% |
| German Russians | 10.2 /100 | #217 | Poor 35.8% |
| Sub-Saharan Africans | 9.8 /100 | #218 | Tragic 35.8% |
| West Indians | 9.7 /100 | #219 | Tragic 35.8% |
| Spanish | 9.6 /100 | #220 | Tragic 35.8% |
| Dutch | 9.2 /100 | #221 | Tragic 35.7% |
| Trinidadians and Tobagonians | 8.8 /100 | #222 | Tragic 35.7% |
| French Canadians | 8.3 /100 | #223 | Tragic 35.6% |
Demographics Similar to Immigrants from Northern Africa by Bachelor's Degree
In terms of bachelor's degree, the demographic groups most similar to Immigrants from Northern Africa are Maltese (41.9%, a difference of 0.070%), Laotian (42.0%, a difference of 0.10%), Greek (42.0%, a difference of 0.22%), Immigrants from Western Europe (42.0%, a difference of 0.23%), and Carpatho Rusyn (42.1%, a difference of 0.35%).
| Demographics | Rating | Rank | Bachelor's Degree |
| Immigrants | Western Asia | 99.2 /100 | #84 | Exceptional 42.3% |
| Lithuanians | 99.2 /100 | #85 | Exceptional 42.2% |
| Immigrants | Brazil | 99.2 /100 | #86 | Exceptional 42.2% |
| Carpatho Rusyns | 99.0 /100 | #87 | Exceptional 42.1% |
| Immigrants | Western Europe | 99.0 /100 | #88 | Exceptional 42.0% |
| Greeks | 99.0 /100 | #89 | Exceptional 42.0% |
| Laotians | 98.9 /100 | #90 | Exceptional 42.0% |
| Immigrants | Northern Africa | 98.9 /100 | #91 | Exceptional 41.9% |
| Maltese | 98.8 /100 | #92 | Exceptional 41.9% |
| Immigrants | Canada | 98.6 /100 | #93 | Exceptional 41.7% |
| Immigrants | Nepal | 98.6 /100 | #94 | Exceptional 41.7% |
| Immigrants | North America | 98.5 /100 | #95 | Exceptional 41.7% |
| Immigrants | Moldova | 98.4 /100 | #96 | Exceptional 41.6% |
| Romanians | 98.4 /100 | #97 | Exceptional 41.6% |
| Immigrants | Ukraine | 98.3 /100 | #98 | Exceptional 41.5% |