Bhutanese vs Immigrants from Italy Doctorate Degree
COMPARE
Bhutanese
Immigrants from Italy
Doctorate Degree
Doctorate Degree Comparison
Bhutanese
Immigrants from Italy
2.3%
DOCTORATE DEGREE
99.9/ 100
METRIC RATING
61st/ 347
METRIC RANK
2.1%
DOCTORATE DEGREE
96.9/ 100
METRIC RATING
113th/ 347
METRIC RANK
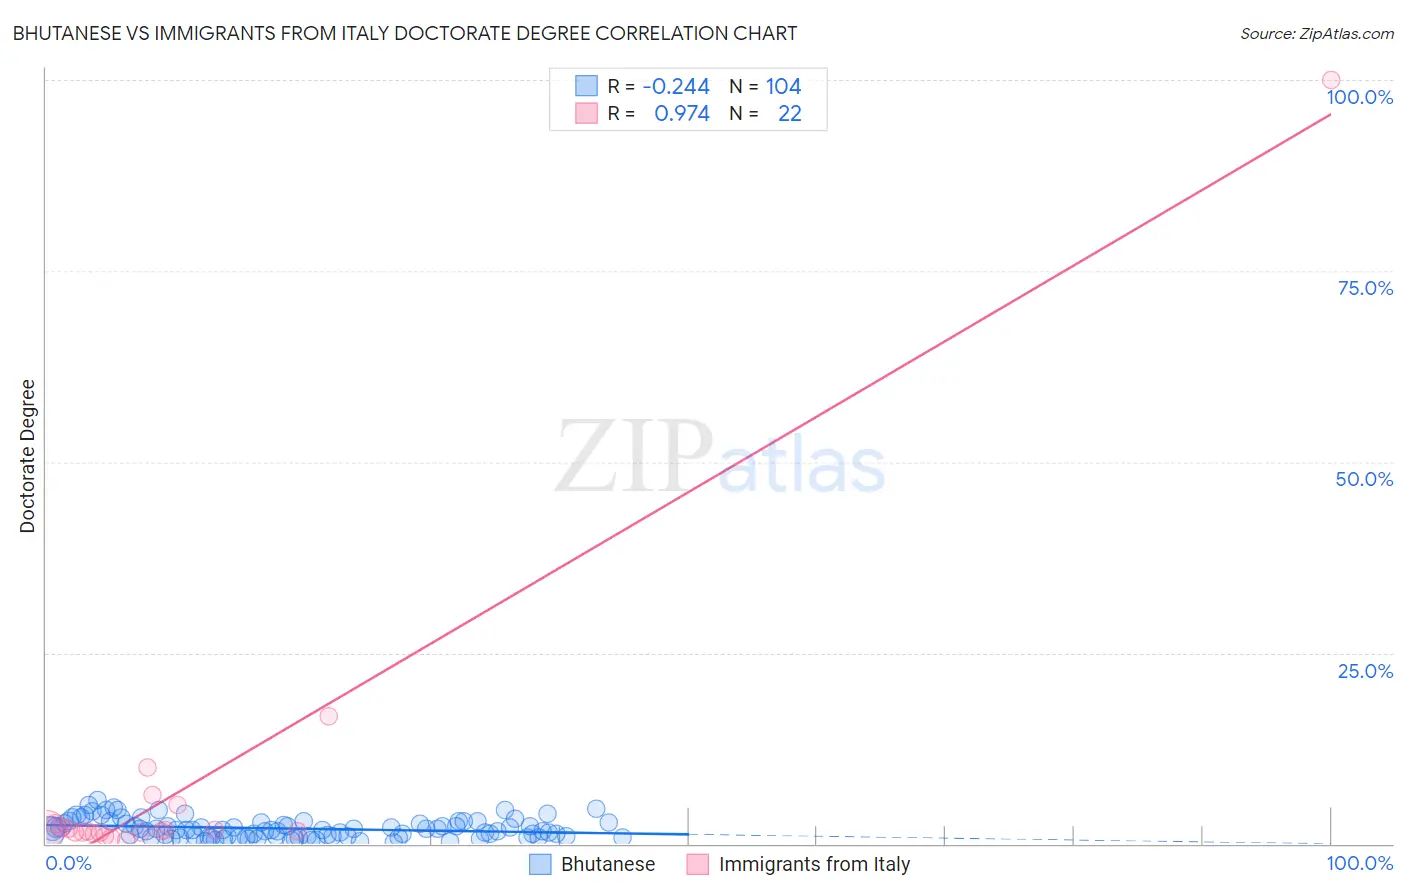
Bhutanese vs Immigrants from Italy Doctorate Degree Correlation Chart
The statistical analysis conducted on geographies consisting of 449,637,432 people shows a weak negative correlation between the proportion of Bhutanese and percentage of population with at least doctorate degree education in the United States with a correlation coefficient (R) of -0.244 and weighted average of 2.3%. Similarly, the statistical analysis conducted on geographies consisting of 322,534,686 people shows a perfect positive correlation between the proportion of Immigrants from Italy and percentage of population with at least doctorate degree education in the United States with a correlation coefficient (R) of 0.974 and weighted average of 2.1%, a difference of 12.1%.
Doctorate Degree Correlation Summary
| Measurement | Bhutanese | Immigrants from Italy |
| Minimum | 0.23% | 0.55% |
| Maximum | 5.7% | 100.0% |
| Range | 5.5% | 99.5% |
| Mean | 2.0% | 7.5% |
| Median | 1.8% | 1.7% |
| Interquartile 25% (IQ1) | 0.94% | 1.4% |
| Interquartile 75% (IQ3) | 2.8% | 2.6% |
| Interquartile Range (IQR) | 1.8% | 1.2% |
| Standard Deviation (Sample) | 1.3% | 21.0% |
| Standard Deviation (Population) | 1.3% | 20.5% |
Similar Demographics by Doctorate Degree
Demographics Similar to Bhutanese by Doctorate Degree
In terms of doctorate degree, the demographic groups most similar to Bhutanese are Immigrants from Europe (2.3%, a difference of 0.52%), Laotian (2.3%, a difference of 0.62%), Immigrants from Serbia (2.3%, a difference of 0.77%), South African (2.3%, a difference of 0.79%), and Immigrants from Greece (2.3%, a difference of 1.0%).
| Demographics | Rating | Rank | Doctorate Degree |
| Immigrants | Indonesia | 100.0 /100 | #54 | Exceptional 2.4% |
| Bolivians | 100.0 /100 | #55 | Exceptional 2.4% |
| Immigrants | Czechoslovakia | 100.0 /100 | #56 | Exceptional 2.4% |
| Immigrants | Ethiopia | 100.0 /100 | #57 | Exceptional 2.4% |
| Ethiopians | 99.9 /100 | #58 | Exceptional 2.3% |
| South Africans | 99.9 /100 | #59 | Exceptional 2.3% |
| Immigrants | Serbia | 99.9 /100 | #60 | Exceptional 2.3% |
| Bhutanese | 99.9 /100 | #61 | Exceptional 2.3% |
| Immigrants | Europe | 99.9 /100 | #62 | Exceptional 2.3% |
| Laotians | 99.9 /100 | #63 | Exceptional 2.3% |
| Immigrants | Greece | 99.9 /100 | #64 | Exceptional 2.3% |
| Paraguayans | 99.9 /100 | #65 | Exceptional 2.3% |
| Argentineans | 99.9 /100 | #66 | Exceptional 2.3% |
| Zimbabweans | 99.8 /100 | #67 | Exceptional 2.3% |
| Immigrants | Kazakhstan | 99.8 /100 | #68 | Exceptional 2.3% |
Demographics Similar to Immigrants from Italy by Doctorate Degree
In terms of doctorate degree, the demographic groups most similar to Immigrants from Italy are Immigrants from Croatia (2.1%, a difference of 0.15%), Syrian (2.1%, a difference of 0.21%), Immigrants from Pakistan (2.1%, a difference of 0.23%), Taiwanese (2.1%, a difference of 0.23%), and Brazilian (2.1%, a difference of 0.29%).
| Demographics | Rating | Rank | Doctorate Degree |
| Sudanese | 97.7 /100 | #106 | Exceptional 2.1% |
| Europeans | 97.5 /100 | #107 | Exceptional 2.1% |
| Immigrants | Germany | 97.3 /100 | #108 | Exceptional 2.1% |
| Ukrainians | 97.2 /100 | #109 | Exceptional 2.1% |
| Brazilians | 97.2 /100 | #110 | Exceptional 2.1% |
| Immigrants | Pakistan | 97.1 /100 | #111 | Exceptional 2.1% |
| Syrians | 97.1 /100 | #112 | Exceptional 2.1% |
| Immigrants | Italy | 96.9 /100 | #113 | Exceptional 2.1% |
| Immigrants | Croatia | 96.8 /100 | #114 | Exceptional 2.1% |
| Taiwanese | 96.7 /100 | #115 | Exceptional 2.1% |
| Maltese | 96.2 /100 | #116 | Exceptional 2.1% |
| Lebanese | 96.0 /100 | #117 | Exceptional 2.1% |
| Icelanders | 96.0 /100 | #118 | Exceptional 2.1% |
| Pakistanis | 95.8 /100 | #119 | Exceptional 2.0% |
| Immigrants | Morocco | 95.5 /100 | #120 | Exceptional 2.0% |