Bahamian vs Immigrants from Senegal 9th Grade
COMPARE
Bahamian
Immigrants from Senegal
9th Grade
9th Grade Comparison
Bahamians
Immigrants from Senegal
94.4%
9TH GRADE
7.0/ 100
METRIC RATING
223rd/ 347
METRIC RANK
94.1%
9TH GRADE
0.9/ 100
METRIC RATING
252nd/ 347
METRIC RANK
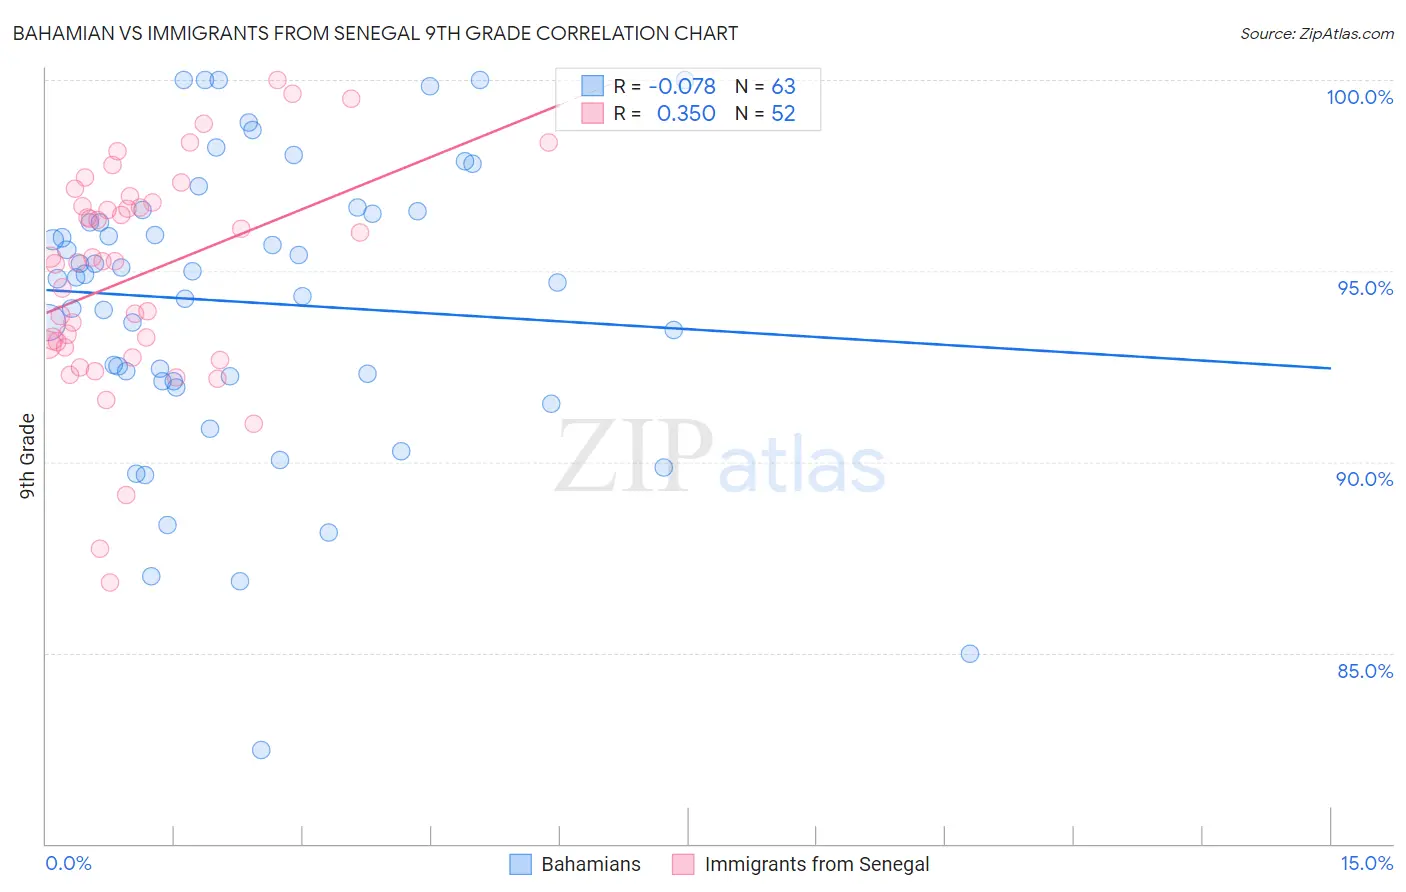
Bahamian vs Immigrants from Senegal 9th Grade Correlation Chart
The statistical analysis conducted on geographies consisting of 112,698,819 people shows a slight negative correlation between the proportion of Bahamians and percentage of population with at least 9th grade education in the United States with a correlation coefficient (R) of -0.078 and weighted average of 94.4%. Similarly, the statistical analysis conducted on geographies consisting of 90,130,297 people shows a mild positive correlation between the proportion of Immigrants from Senegal and percentage of population with at least 9th grade education in the United States with a correlation coefficient (R) of 0.350 and weighted average of 94.1%, a difference of 0.39%.
9th Grade Correlation Summary
| Measurement | Bahamian | Immigrants from Senegal |
| Minimum | 82.5% | 86.8% |
| Maximum | 100.0% | 100.0% |
| Range | 17.5% | 13.2% |
| Mean | 94.2% | 94.9% |
| Median | 94.8% | 95.3% |
| Interquartile 25% (IQ1) | 92.1% | 93.0% |
| Interquartile 75% (IQ3) | 96.6% | 96.8% |
| Interquartile Range (IQR) | 4.4% | 3.7% |
| Standard Deviation (Sample) | 3.8% | 2.9% |
| Standard Deviation (Population) | 3.8% | 2.8% |
Similar Demographics by 9th Grade
Demographics Similar to Bahamians by 9th Grade
In terms of 9th grade, the demographic groups most similar to Bahamians are Immigrants from Asia (94.4%, a difference of 0.020%), Immigrants from Eastern Africa (94.5%, a difference of 0.030%), Tongan (94.4%, a difference of 0.030%), Indian (Asian) (94.5%, a difference of 0.040%), and Portuguese (94.5%, a difference of 0.050%).
| Demographics | Rating | Rank | 9th Grade |
| Immigrants | Western Asia | 10.7 /100 | #216 | Poor 94.5% |
| Asians | 9.9 /100 | #217 | Tragic 94.5% |
| Portuguese | 9.2 /100 | #218 | Tragic 94.5% |
| Africans | 9.0 /100 | #219 | Tragic 94.5% |
| Indians (Asian) | 8.6 /100 | #220 | Tragic 94.5% |
| Immigrants | Eastern Africa | 8.2 /100 | #221 | Tragic 94.5% |
| Immigrants | Asia | 7.7 /100 | #222 | Tragic 94.4% |
| Bahamians | 7.0 /100 | #223 | Tragic 94.4% |
| Tongans | 6.0 /100 | #224 | Tragic 94.4% |
| Ethiopians | 5.4 /100 | #225 | Tragic 94.4% |
| Sub-Saharan Africans | 5.4 /100 | #226 | Tragic 94.4% |
| Immigrants | Sierra Leone | 4.8 /100 | #227 | Tragic 94.4% |
| Lumbee | 4.7 /100 | #228 | Tragic 94.4% |
| Immigrants | Southern Europe | 4.5 /100 | #229 | Tragic 94.3% |
| Apache | 4.2 /100 | #230 | Tragic 94.3% |
Demographics Similar to Immigrants from Senegal by 9th Grade
In terms of 9th grade, the demographic groups most similar to Immigrants from Senegal are Jamaican (94.1%, a difference of 0.010%), Colombian (94.0%, a difference of 0.020%), U.S. Virgin Islander (94.0%, a difference of 0.050%), Immigrants from Hong Kong (94.1%, a difference of 0.060%), and Uruguayan (94.1%, a difference of 0.070%).
| Demographics | Rating | Rank | 9th Grade |
| Paiute | 1.9 /100 | #245 | Tragic 94.2% |
| Senegalese | 1.9 /100 | #246 | Tragic 94.2% |
| Afghans | 1.8 /100 | #247 | Tragic 94.2% |
| Immigrants | Somalia | 1.4 /100 | #248 | Tragic 94.1% |
| Uruguayans | 1.3 /100 | #249 | Tragic 94.1% |
| Immigrants | Hong Kong | 1.3 /100 | #250 | Tragic 94.1% |
| Jamaicans | 1.0 /100 | #251 | Tragic 94.1% |
| Immigrants | Senegal | 0.9 /100 | #252 | Tragic 94.1% |
| Colombians | 0.8 /100 | #253 | Tragic 94.0% |
| U.S. Virgin Islanders | 0.7 /100 | #254 | Tragic 94.0% |
| Immigrants | Nigeria | 0.6 /100 | #255 | Tragic 94.0% |
| Immigrants | Afghanistan | 0.5 /100 | #256 | Tragic 94.0% |
| Immigrants | Costa Rica | 0.5 /100 | #257 | Tragic 94.0% |
| Immigrants | Thailand | 0.5 /100 | #258 | Tragic 93.9% |
| Ghanaians | 0.5 /100 | #259 | Tragic 93.9% |