Albanian vs Liberian 10th Grade
COMPARE
Albanian
Liberian
10th Grade
10th Grade Comparison
Albanians
Liberians
94.1%
10TH GRADE
86.5/ 100
METRIC RATING
142nd/ 347
METRIC RANK
93.6%
10TH GRADE
34.7/ 100
METRIC RATING
187th/ 347
METRIC RANK
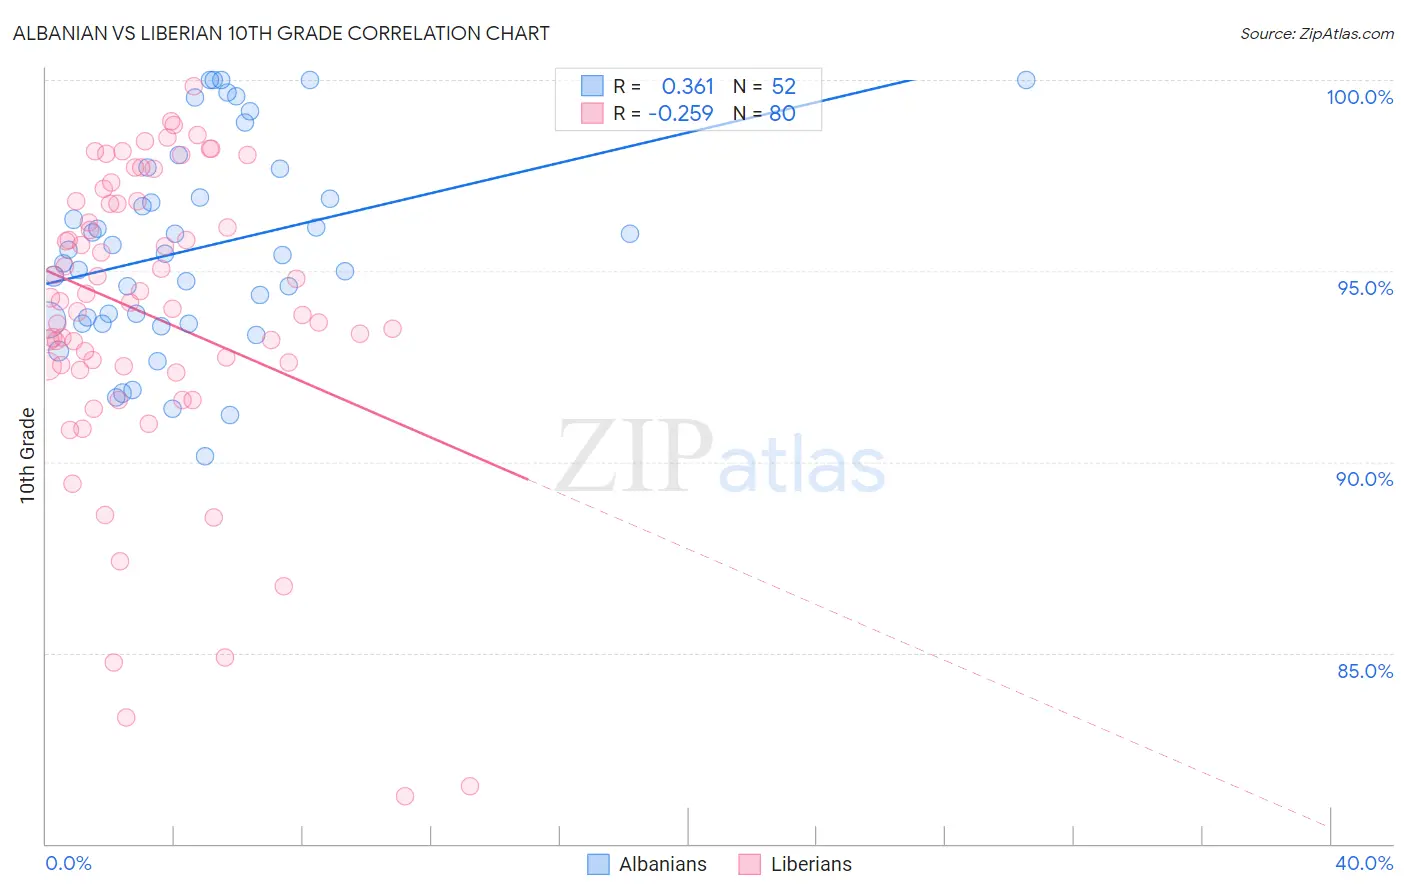
Albanian vs Liberian 10th Grade Correlation Chart
The statistical analysis conducted on geographies consisting of 193,265,850 people shows a mild positive correlation between the proportion of Albanians and percentage of population with at least 10th grade education in the United States with a correlation coefficient (R) of 0.361 and weighted average of 94.1%. Similarly, the statistical analysis conducted on geographies consisting of 118,103,458 people shows a weak negative correlation between the proportion of Liberians and percentage of population with at least 10th grade education in the United States with a correlation coefficient (R) of -0.259 and weighted average of 93.6%, a difference of 0.56%.
10th Grade Correlation Summary
| Measurement | Albanian | Liberian |
| Minimum | 90.1% | 81.2% |
| Maximum | 100.0% | 99.8% |
| Range | 9.9% | 18.6% |
| Mean | 95.6% | 93.8% |
| Median | 95.4% | 94.2% |
| Interquartile 25% (IQ1) | 93.7% | 92.5% |
| Interquartile 75% (IQ3) | 97.3% | 96.8% |
| Interquartile Range (IQR) | 3.6% | 4.3% |
| Standard Deviation (Sample) | 2.6% | 4.0% |
| Standard Deviation (Population) | 2.6% | 3.9% |
Similar Demographics by 10th Grade
Demographics Similar to Albanians by 10th Grade
In terms of 10th grade, the demographic groups most similar to Albanians are Hmong (94.1%, a difference of 0.0%), Immigrants from Jordan (94.1%, a difference of 0.020%), Cherokee (94.1%, a difference of 0.030%), Immigrants from Kazakhstan (94.1%, a difference of 0.030%), and Nonimmigrants (94.1%, a difference of 0.050%).
| Demographics | Rating | Rank | 10th Grade |
| Immigrants | Korea | 91.3 /100 | #135 | Exceptional 94.2% |
| Shoshone | 90.8 /100 | #136 | Exceptional 94.2% |
| Arapaho | 90.5 /100 | #137 | Exceptional 94.2% |
| Immigrants | Sri Lanka | 89.9 /100 | #138 | Excellent 94.2% |
| Immigrants | Bosnia and Herzegovina | 89.4 /100 | #139 | Excellent 94.2% |
| Immigrants | Jordan | 87.6 /100 | #140 | Excellent 94.1% |
| Hmong | 86.6 /100 | #141 | Excellent 94.1% |
| Albanians | 86.5 /100 | #142 | Excellent 94.1% |
| Cherokee | 84.9 /100 | #143 | Excellent 94.1% |
| Immigrants | Kazakhstan | 84.9 /100 | #144 | Excellent 94.1% |
| Immigrants | Nonimmigrants | 83.8 /100 | #145 | Excellent 94.1% |
| Chickasaw | 82.6 /100 | #146 | Excellent 94.1% |
| Immigrants | Ukraine | 81.5 /100 | #147 | Excellent 94.0% |
| Arabs | 80.9 /100 | #148 | Excellent 94.0% |
| Ugandans | 80.7 /100 | #149 | Excellent 94.0% |
Demographics Similar to Liberians by 10th Grade
In terms of 10th grade, the demographic groups most similar to Liberians are Immigrants from Eastern Asia (93.6%, a difference of 0.0%), Guamanian/Chamorro (93.6%, a difference of 0.020%), Choctaw (93.6%, a difference of 0.020%), Sudanese (93.6%, a difference of 0.020%), and Marshallese (93.6%, a difference of 0.020%).
| Demographics | Rating | Rank | 10th Grade |
| Blackfeet | 42.8 /100 | #180 | Average 93.7% |
| Immigrants | Northern Africa | 41.6 /100 | #181 | Average 93.7% |
| Colville | 38.8 /100 | #182 | Fair 93.6% |
| Guamanians/Chamorros | 37.1 /100 | #183 | Fair 93.6% |
| Choctaw | 36.6 /100 | #184 | Fair 93.6% |
| Sudanese | 36.6 /100 | #185 | Fair 93.6% |
| Immigrants | Eastern Asia | 35.1 /100 | #186 | Fair 93.6% |
| Liberians | 34.7 /100 | #187 | Fair 93.6% |
| Marshallese | 33.2 /100 | #188 | Fair 93.6% |
| Immigrants | Pakistan | 32.5 /100 | #189 | Fair 93.6% |
| Laotians | 32.1 /100 | #190 | Fair 93.6% |
| Yup'ik | 31.1 /100 | #191 | Fair 93.6% |
| Immigrants | Malaysia | 28.0 /100 | #192 | Fair 93.5% |
| Panamanians | 28.0 /100 | #193 | Fair 93.5% |
| Immigrants | Morocco | 26.9 /100 | #194 | Fair 93.5% |