Bahamian vs Immigrants from Croatia 10th Grade
COMPARE
Bahamian
Immigrants from Croatia
10th Grade
10th Grade Comparison
Bahamians
Immigrants from Croatia
93.1%
10TH GRADE
4.9/ 100
METRIC RATING
232nd/ 347
METRIC RANK
94.5%
10TH GRADE
97.4/ 100
METRIC RATING
107th/ 347
METRIC RANK
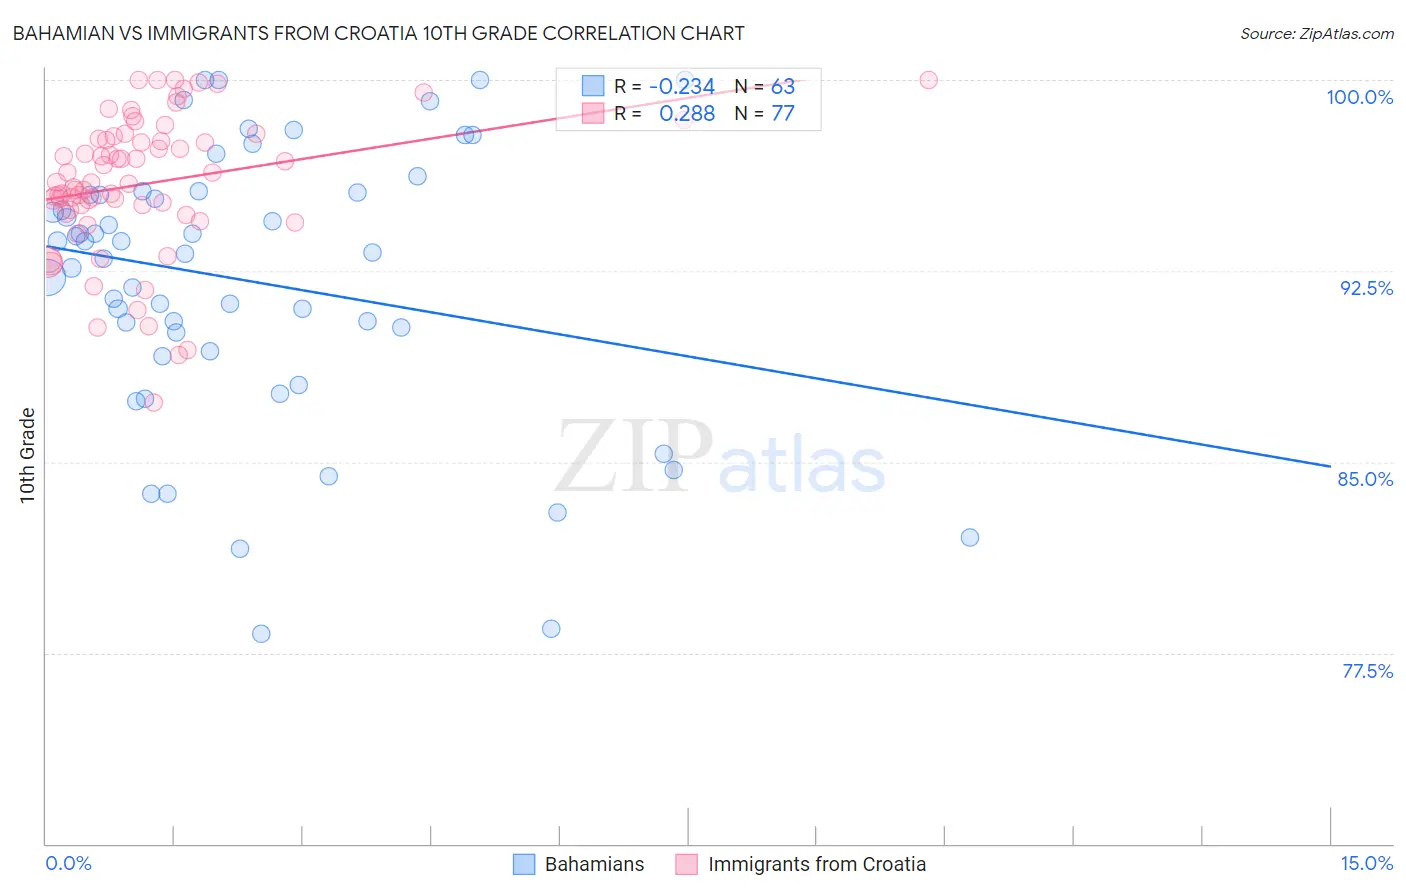
Bahamian vs Immigrants from Croatia 10th Grade Correlation Chart
The statistical analysis conducted on geographies consisting of 112,698,819 people shows a weak negative correlation between the proportion of Bahamians and percentage of population with at least 10th grade education in the United States with a correlation coefficient (R) of -0.234 and weighted average of 93.1%. Similarly, the statistical analysis conducted on geographies consisting of 132,548,291 people shows a weak positive correlation between the proportion of Immigrants from Croatia and percentage of population with at least 10th grade education in the United States with a correlation coefficient (R) of 0.288 and weighted average of 94.5%, a difference of 1.5%.
10th Grade Correlation Summary
| Measurement | Bahamian | Immigrants from Croatia |
| Minimum | 78.2% | 87.3% |
| Maximum | 100.0% | 100.0% |
| Range | 21.8% | 12.7% |
| Mean | 92.1% | 95.9% |
| Median | 93.2% | 96.0% |
| Interquartile 25% (IQ1) | 89.3% | 94.8% |
| Interquartile 75% (IQ3) | 95.6% | 97.7% |
| Interquartile Range (IQR) | 6.2% | 2.9% |
| Standard Deviation (Sample) | 5.3% | 2.8% |
| Standard Deviation (Population) | 5.3% | 2.7% |
Similar Demographics by 10th Grade
Demographics Similar to Bahamians by 10th Grade
In terms of 10th grade, the demographic groups most similar to Bahamians are South American Indian (93.1%, a difference of 0.0%), Comanche (93.1%, a difference of 0.0%), Immigrants from Ethiopia (93.1%, a difference of 0.010%), Immigrants from Africa (93.1%, a difference of 0.010%), and Subsaharan African (93.1%, a difference of 0.010%).
| Demographics | Rating | Rank | 10th Grade |
| Somalis | 6.2 /100 | #225 | Tragic 93.2% |
| Koreans | 6.1 /100 | #226 | Tragic 93.2% |
| Blacks/African Americans | 6.0 /100 | #227 | Tragic 93.2% |
| Immigrants | China | 5.9 /100 | #228 | Tragic 93.2% |
| Immigrants | Ethiopia | 5.1 /100 | #229 | Tragic 93.1% |
| Immigrants | Africa | 5.0 /100 | #230 | Tragic 93.1% |
| South American Indians | 4.9 /100 | #231 | Tragic 93.1% |
| Bahamians | 4.9 /100 | #232 | Tragic 93.1% |
| Comanche | 4.9 /100 | #233 | Tragic 93.1% |
| Sub-Saharan Africans | 4.7 /100 | #234 | Tragic 93.1% |
| Africans | 4.6 /100 | #235 | Tragic 93.1% |
| Afghans | 4.5 /100 | #236 | Tragic 93.1% |
| Immigrants | Panama | 4.3 /100 | #237 | Tragic 93.1% |
| Nigerians | 4.2 /100 | #238 | Tragic 93.1% |
| Costa Ricans | 4.2 /100 | #239 | Tragic 93.1% |
Demographics Similar to Immigrants from Croatia by 10th Grade
In terms of 10th grade, the demographic groups most similar to Immigrants from Croatia are Immigrants from Turkey (94.5%, a difference of 0.0%), Immigrants from Serbia (94.5%, a difference of 0.0%), Immigrants from Europe (94.5%, a difference of 0.010%), Immigrants from Romania (94.5%, a difference of 0.010%), and Immigrants from North Macedonia (94.5%, a difference of 0.010%).
| Demographics | Rating | Rank | 10th Grade |
| Immigrants | South Central Asia | 97.8 /100 | #100 | Exceptional 94.5% |
| Syrians | 97.7 /100 | #101 | Exceptional 94.5% |
| Cambodians | 97.6 /100 | #102 | Exceptional 94.5% |
| Immigrants | Europe | 97.5 /100 | #103 | Exceptional 94.5% |
| Immigrants | Romania | 97.5 /100 | #104 | Exceptional 94.5% |
| Immigrants | Turkey | 97.4 /100 | #105 | Exceptional 94.5% |
| Immigrants | Serbia | 97.4 /100 | #106 | Exceptional 94.5% |
| Immigrants | Croatia | 97.4 /100 | #107 | Exceptional 94.5% |
| Immigrants | North Macedonia | 97.2 /100 | #108 | Exceptional 94.5% |
| Immigrants | Norway | 97.2 /100 | #109 | Exceptional 94.5% |
| Burmese | 97.1 /100 | #110 | Exceptional 94.5% |
| Immigrants | Zimbabwe | 96.8 /100 | #111 | Exceptional 94.4% |
| Immigrants | Kuwait | 96.8 /100 | #112 | Exceptional 94.4% |
| Palestinians | 96.5 /100 | #113 | Exceptional 94.4% |
| German Russians | 96.3 /100 | #114 | Exceptional 94.4% |