Cree vs Liberian 10th Grade
COMPARE
Cree
Liberian
10th Grade
10th Grade Comparison
Cree
Liberians
94.4%
10TH GRADE
95.1/ 100
METRIC RATING
123rd/ 347
METRIC RANK
93.6%
10TH GRADE
34.7/ 100
METRIC RATING
187th/ 347
METRIC RANK
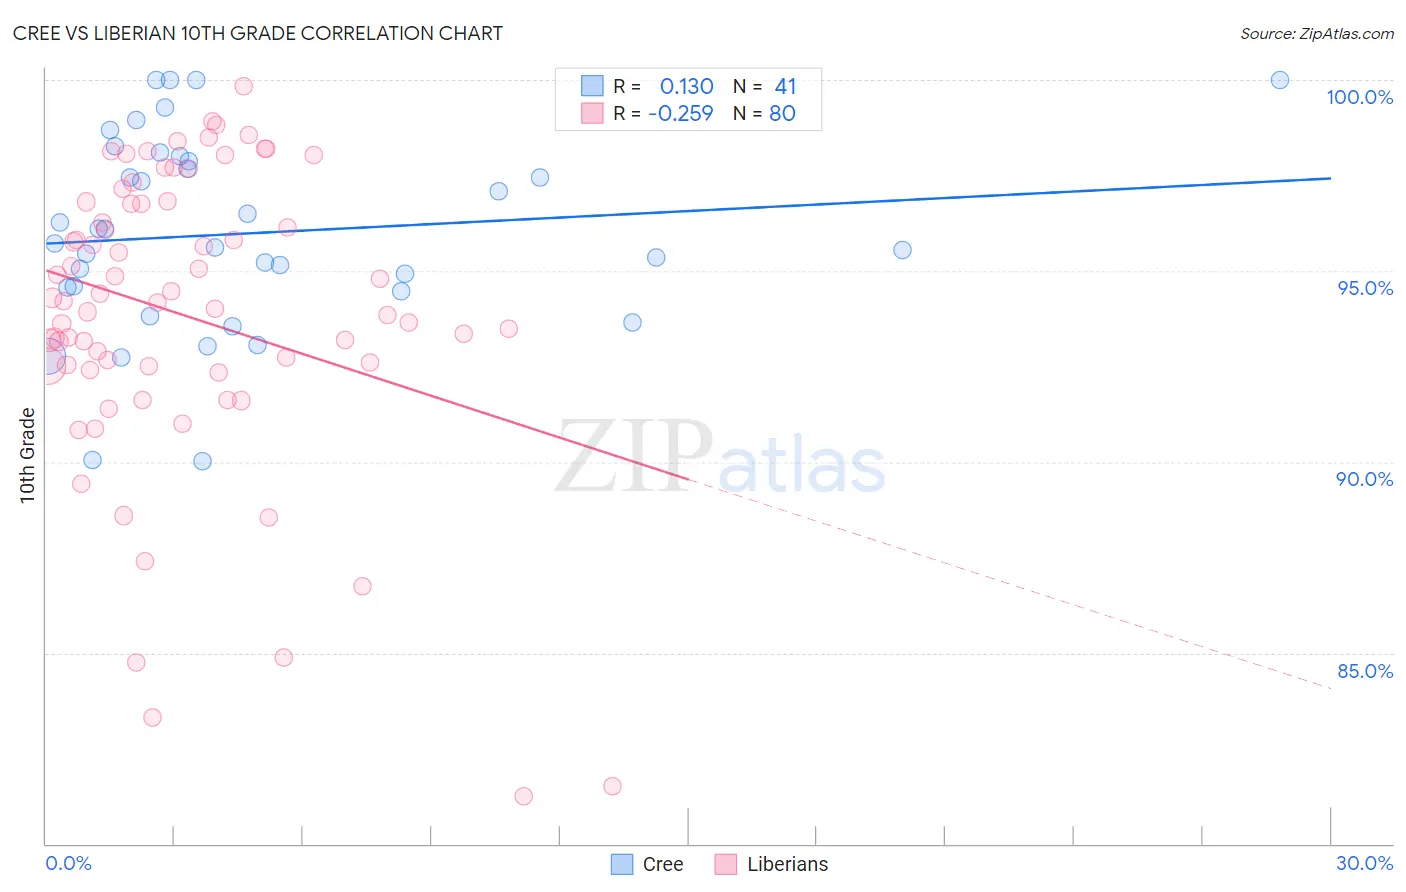
Cree vs Liberian 10th Grade Correlation Chart
The statistical analysis conducted on geographies consisting of 76,211,744 people shows a poor positive correlation between the proportion of Cree and percentage of population with at least 10th grade education in the United States with a correlation coefficient (R) of 0.130 and weighted average of 94.4%. Similarly, the statistical analysis conducted on geographies consisting of 118,103,458 people shows a weak negative correlation between the proportion of Liberians and percentage of population with at least 10th grade education in the United States with a correlation coefficient (R) of -0.259 and weighted average of 93.6%, a difference of 0.81%.
10th Grade Correlation Summary
| Measurement | Cree | Liberian |
| Minimum | 90.0% | 81.2% |
| Maximum | 100.0% | 99.8% |
| Range | 10.0% | 18.6% |
| Mean | 96.0% | 93.8% |
| Median | 95.7% | 94.2% |
| Interquartile 25% (IQ1) | 94.5% | 92.5% |
| Interquartile 75% (IQ3) | 97.9% | 96.8% |
| Interquartile Range (IQR) | 3.4% | 4.3% |
| Standard Deviation (Sample) | 2.5% | 4.0% |
| Standard Deviation (Population) | 2.5% | 3.9% |
Similar Demographics by 10th Grade
Demographics Similar to Cree by 10th Grade
In terms of 10th grade, the demographic groups most similar to Cree are Immigrants from Belarus (94.4%, a difference of 0.0%), Inupiat (94.4%, a difference of 0.0%), Immigrants from Taiwan (94.4%, a difference of 0.010%), Basque (94.3%, a difference of 0.010%), and Jordanian (94.4%, a difference of 0.020%).
| Demographics | Rating | Rank | 10th Grade |
| Sioux | 96.2 /100 | #116 | Exceptional 94.4% |
| Immigrants | Hungary | 95.8 /100 | #117 | Exceptional 94.4% |
| Jordanians | 95.6 /100 | #118 | Exceptional 94.4% |
| Immigrants | Israel | 95.4 /100 | #119 | Exceptional 94.4% |
| Immigrants | Taiwan | 95.3 /100 | #120 | Exceptional 94.4% |
| Immigrants | Belarus | 95.2 /100 | #121 | Exceptional 94.4% |
| Inupiat | 95.1 /100 | #122 | Exceptional 94.4% |
| Cree | 95.1 /100 | #123 | Exceptional 94.4% |
| Basques | 94.9 /100 | #124 | Exceptional 94.3% |
| Americans | 94.4 /100 | #125 | Exceptional 94.3% |
| Immigrants | Iran | 94.4 /100 | #126 | Exceptional 94.3% |
| Israelis | 93.8 /100 | #127 | Exceptional 94.3% |
| Potawatomi | 93.6 /100 | #128 | Exceptional 94.3% |
| Iroquois | 92.8 /100 | #129 | Exceptional 94.3% |
| Immigrants | Greece | 92.7 /100 | #130 | Exceptional 94.3% |
Demographics Similar to Liberians by 10th Grade
In terms of 10th grade, the demographic groups most similar to Liberians are Immigrants from Eastern Asia (93.6%, a difference of 0.0%), Guamanian/Chamorro (93.6%, a difference of 0.020%), Choctaw (93.6%, a difference of 0.020%), Sudanese (93.6%, a difference of 0.020%), and Marshallese (93.6%, a difference of 0.020%).
| Demographics | Rating | Rank | 10th Grade |
| Blackfeet | 42.8 /100 | #180 | Average 93.7% |
| Immigrants | Northern Africa | 41.6 /100 | #181 | Average 93.7% |
| Colville | 38.8 /100 | #182 | Fair 93.6% |
| Guamanians/Chamorros | 37.1 /100 | #183 | Fair 93.6% |
| Choctaw | 36.6 /100 | #184 | Fair 93.6% |
| Sudanese | 36.6 /100 | #185 | Fair 93.6% |
| Immigrants | Eastern Asia | 35.1 /100 | #186 | Fair 93.6% |
| Liberians | 34.7 /100 | #187 | Fair 93.6% |
| Marshallese | 33.2 /100 | #188 | Fair 93.6% |
| Immigrants | Pakistan | 32.5 /100 | #189 | Fair 93.6% |
| Laotians | 32.1 /100 | #190 | Fair 93.6% |
| Yup'ik | 31.1 /100 | #191 | Fair 93.6% |
| Immigrants | Malaysia | 28.0 /100 | #192 | Fair 93.5% |
| Panamanians | 28.0 /100 | #193 | Fair 93.5% |
| Immigrants | Morocco | 26.9 /100 | #194 | Fair 93.5% |