Bahamian vs Immigrants from Portugal 2nd Grade
COMPARE
Bahamian
Immigrants from Portugal
2nd Grade
2nd Grade Comparison
Bahamians
Immigrants from Portugal
97.7%
2ND GRADE
6.8/ 100
METRIC RATING
215th/ 347
METRIC RANK
97.2%
2ND GRADE
0.0/ 100
METRIC RATING
287th/ 347
METRIC RANK
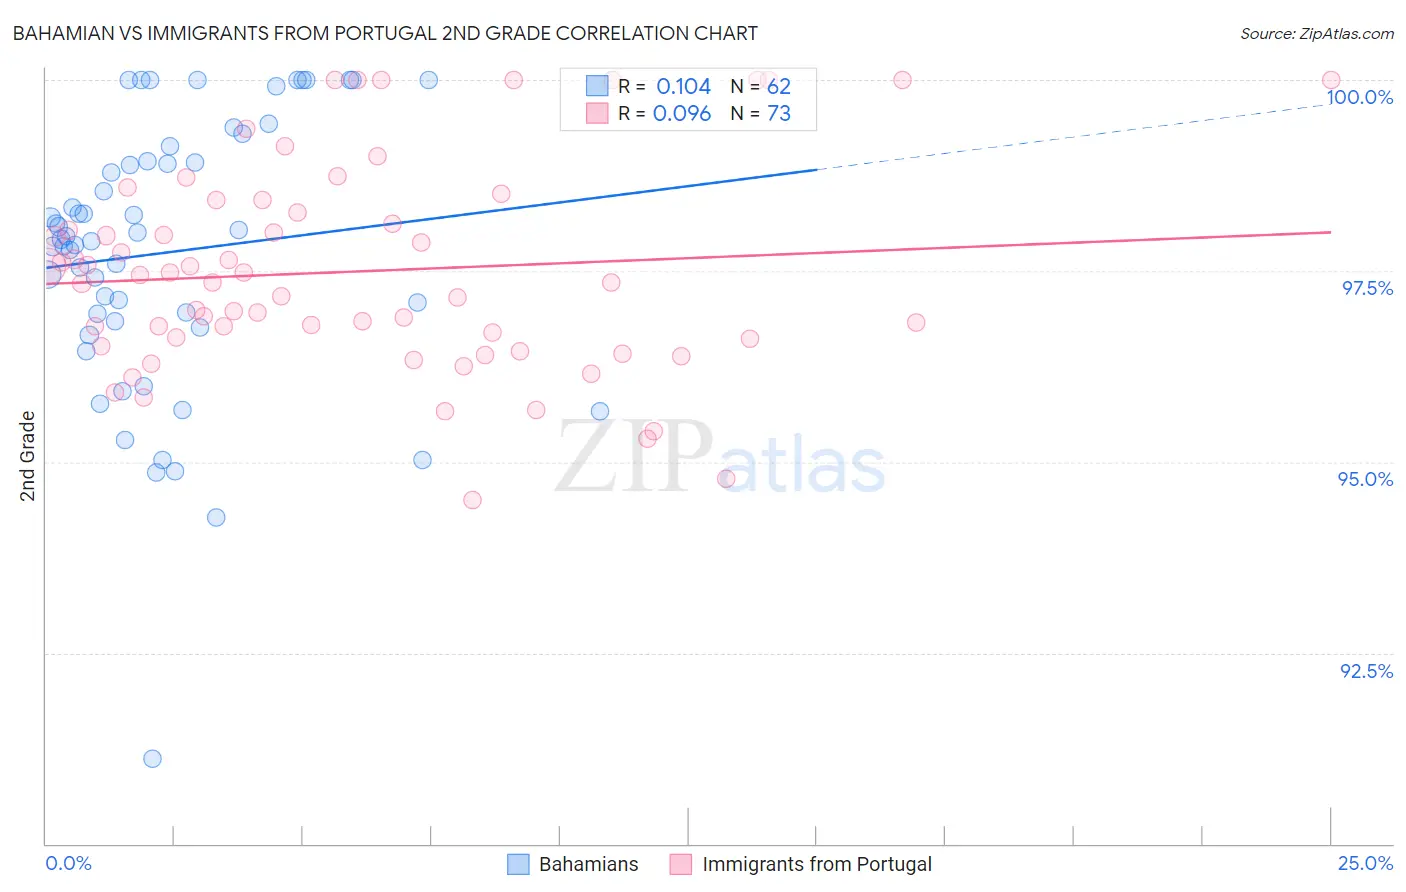
Bahamian vs Immigrants from Portugal 2nd Grade Correlation Chart
The statistical analysis conducted on geographies consisting of 112,673,855 people shows a poor positive correlation between the proportion of Bahamians and percentage of population with at least 2nd grade education in the United States with a correlation coefficient (R) of 0.104 and weighted average of 97.7%. Similarly, the statistical analysis conducted on geographies consisting of 174,792,107 people shows a slight positive correlation between the proportion of Immigrants from Portugal and percentage of population with at least 2nd grade education in the United States with a correlation coefficient (R) of 0.096 and weighted average of 97.2%, a difference of 0.46%.
2nd Grade Correlation Summary
| Measurement | Bahamian | Immigrants from Portugal |
| Minimum | 91.1% | 94.5% |
| Maximum | 100.0% | 100.0% |
| Range | 8.9% | 5.5% |
| Mean | 97.7% | 97.5% |
| Median | 97.9% | 97.4% |
| Interquartile 25% (IQ1) | 96.8% | 96.6% |
| Interquartile 75% (IQ3) | 98.9% | 98.3% |
| Interquartile Range (IQR) | 2.1% | 1.8% |
| Standard Deviation (Sample) | 1.8% | 1.4% |
| Standard Deviation (Population) | 1.8% | 1.3% |
Similar Demographics by 2nd Grade
Demographics Similar to Bahamians by 2nd Grade
In terms of 2nd grade, the demographic groups most similar to Bahamians are Samoan (97.7%, a difference of 0.0%), South American Indian (97.7%, a difference of 0.0%), Uruguayan (97.7%, a difference of 0.010%), Immigrants from Bahamas (97.7%, a difference of 0.020%), and Moroccan (97.7%, a difference of 0.020%).
| Demographics | Rating | Rank | 2nd Grade |
| Immigrants | Northern Africa | 12.3 /100 | #208 | Poor 97.7% |
| Immigrants | Oceania | 10.9 /100 | #209 | Poor 97.7% |
| Costa Ricans | 10.5 /100 | #210 | Poor 97.7% |
| Laotians | 9.9 /100 | #211 | Tragic 97.7% |
| Immigrants | Bahamas | 8.4 /100 | #212 | Tragic 97.7% |
| Moroccans | 8.2 /100 | #213 | Tragic 97.7% |
| Samoans | 7.1 /100 | #214 | Tragic 97.7% |
| Bahamians | 6.8 /100 | #215 | Tragic 97.7% |
| South American Indians | 6.7 /100 | #216 | Tragic 97.7% |
| Uruguayans | 6.2 /100 | #217 | Tragic 97.7% |
| Sudanese | 5.7 /100 | #218 | Tragic 97.7% |
| Immigrants | Panama | 5.1 /100 | #219 | Tragic 97.6% |
| Immigrants | Morocco | 5.0 /100 | #220 | Tragic 97.6% |
| Iraqis | 4.6 /100 | #221 | Tragic 97.6% |
| Immigrants | Sudan | 4.5 /100 | #222 | Tragic 97.6% |
Demographics Similar to Immigrants from Portugal by 2nd Grade
In terms of 2nd grade, the demographic groups most similar to Immigrants from Portugal are Immigrants from Hong Kong (97.2%, a difference of 0.0%), Immigrants from Barbados (97.2%, a difference of 0.0%), Immigrants from Thailand (97.2%, a difference of 0.010%), Immigrants from Trinidad and Tobago (97.2%, a difference of 0.020%), and Immigrants from West Indies (97.2%, a difference of 0.020%).
| Demographics | Rating | Rank | 2nd Grade |
| Afghans | 0.1 /100 | #280 | Tragic 97.3% |
| Trinidadians and Tobagonians | 0.1 /100 | #281 | Tragic 97.3% |
| Barbadians | 0.1 /100 | #282 | Tragic 97.3% |
| Immigrants | Trinidad and Tobago | 0.0 /100 | #283 | Tragic 97.2% |
| Immigrants | West Indies | 0.0 /100 | #284 | Tragic 97.2% |
| Immigrants | Hong Kong | 0.0 /100 | #285 | Tragic 97.2% |
| Immigrants | Barbados | 0.0 /100 | #286 | Tragic 97.2% |
| Immigrants | Portugal | 0.0 /100 | #287 | Tragic 97.2% |
| Immigrants | Thailand | 0.0 /100 | #288 | Tragic 97.2% |
| Houma | 0.0 /100 | #289 | Tragic 97.2% |
| Immigrants | St. Vincent and the Grenadines | 0.0 /100 | #290 | Tragic 97.2% |
| Immigrants | Afghanistan | 0.0 /100 | #291 | Tragic 97.2% |
| Immigrants | Eritrea | 0.0 /100 | #292 | Tragic 97.2% |
| British West Indians | 0.0 /100 | #293 | Tragic 97.2% |
| Malaysians | 0.0 /100 | #294 | Tragic 97.1% |