Bahamian vs Immigrants from Central America 5th Grade
COMPARE
Bahamian
Immigrants from Central America
5th Grade
5th Grade Comparison
Bahamians
Immigrants from Central America
97.0%
5TH GRADE
5.3/ 100
METRIC RATING
225th/ 347
METRIC RANK
94.7%
5TH GRADE
0.0/ 100
METRIC RATING
342nd/ 347
METRIC RANK
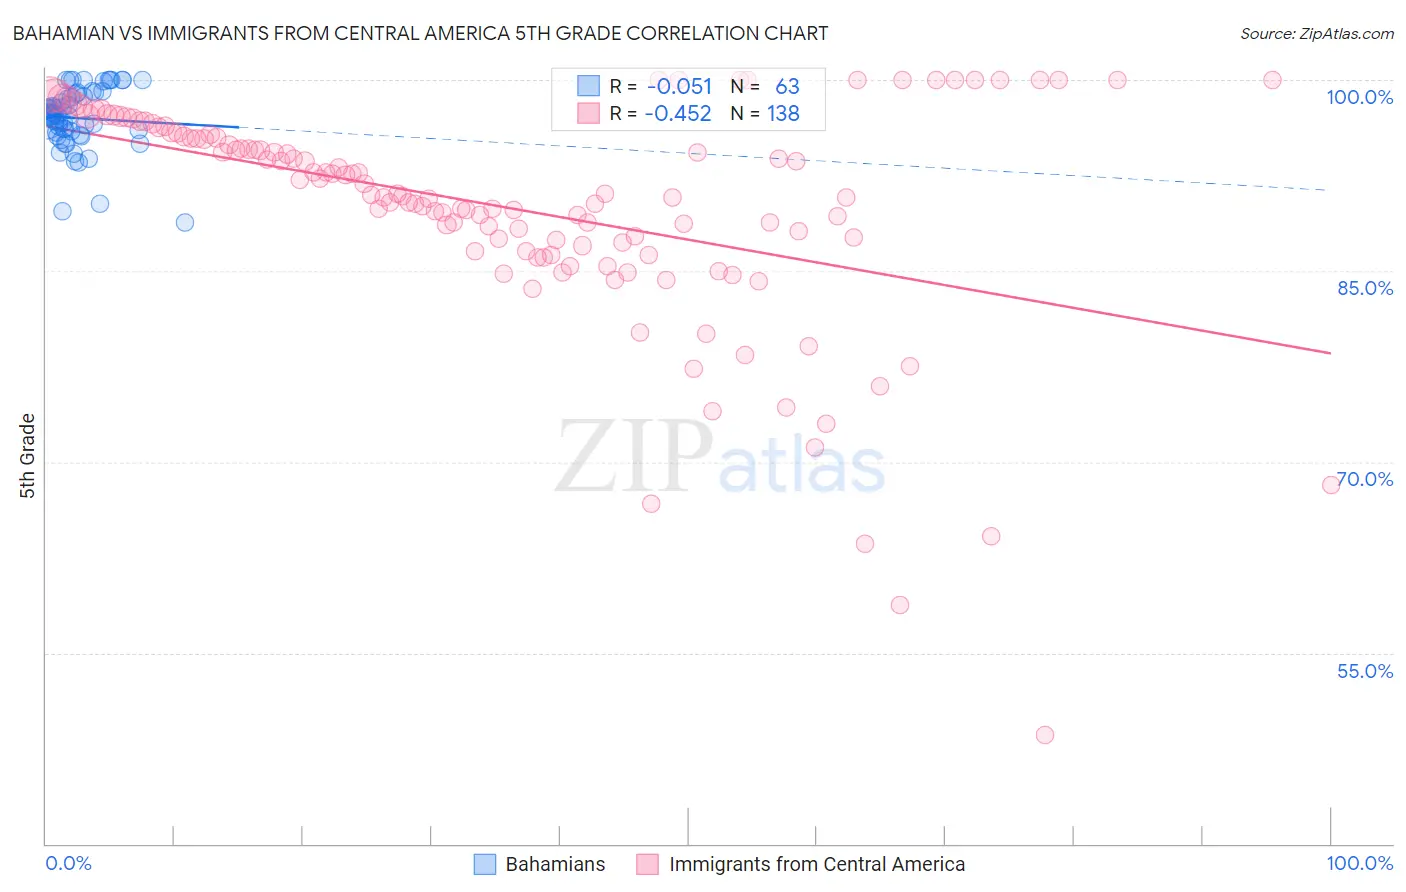
Bahamian vs Immigrants from Central America 5th Grade Correlation Chart
The statistical analysis conducted on geographies consisting of 112,698,819 people shows a slight negative correlation between the proportion of Bahamians and percentage of population with at least 5th grade education in the United States with a correlation coefficient (R) of -0.051 and weighted average of 97.0%. Similarly, the statistical analysis conducted on geographies consisting of 536,554,577 people shows a moderate negative correlation between the proportion of Immigrants from Central America and percentage of population with at least 5th grade education in the United States with a correlation coefficient (R) of -0.452 and weighted average of 94.7%, a difference of 2.5%.
5th Grade Correlation Summary
| Measurement | Bahamian | Immigrants from Central America |
| Minimum | 88.8% | 48.6% |
| Maximum | 100.0% | 100.0% |
| Range | 11.2% | 51.4% |
| Mean | 97.0% | 90.0% |
| Median | 97.3% | 91.0% |
| Interquartile 25% (IQ1) | 95.8% | 87.0% |
| Interquartile 75% (IQ3) | 98.9% | 95.9% |
| Interquartile Range (IQR) | 3.1% | 8.9% |
| Standard Deviation (Sample) | 2.5% | 8.8% |
| Standard Deviation (Population) | 2.4% | 8.8% |
Similar Demographics by 5th Grade
Demographics Similar to Bahamians by 5th Grade
In terms of 5th grade, the demographic groups most similar to Bahamians are South American Indian (97.0%, a difference of 0.0%), Tongan (97.0%, a difference of 0.0%), Sierra Leonean (97.1%, a difference of 0.010%), Immigrants from Panama (97.0%, a difference of 0.010%), and Liberian (97.0%, a difference of 0.010%).
| Demographics | Rating | Rank | 5th Grade |
| Immigrants | Sudan | 6.5 /100 | #218 | Tragic 97.1% |
| Immigrants | Syria | 6.4 /100 | #219 | Tragic 97.1% |
| Immigrants | Southern Europe | 6.3 /100 | #220 | Tragic 97.1% |
| Sierra Leoneans | 6.0 /100 | #221 | Tragic 97.1% |
| Immigrants | Panama | 5.7 /100 | #222 | Tragic 97.0% |
| Liberians | 5.7 /100 | #223 | Tragic 97.0% |
| South American Indians | 5.4 /100 | #224 | Tragic 97.0% |
| Bahamians | 5.3 /100 | #225 | Tragic 97.0% |
| Tongans | 5.3 /100 | #226 | Tragic 97.0% |
| Immigrants | Pakistan | 4.7 /100 | #227 | Tragic 97.0% |
| Assyrians/Chaldeans/Syriacs | 4.5 /100 | #228 | Tragic 97.0% |
| Yuman | 4.5 /100 | #229 | Tragic 97.0% |
| Immigrants | Western Asia | 4.3 /100 | #230 | Tragic 97.0% |
| Immigrants | Malaysia | 4.1 /100 | #231 | Tragic 97.0% |
| Immigrants | Eastern Asia | 4.0 /100 | #232 | Tragic 97.0% |
Demographics Similar to Immigrants from Central America by 5th Grade
In terms of 5th grade, the demographic groups most similar to Immigrants from Central America are Salvadoran (94.6%, a difference of 0.060%), Immigrants from Mexico (94.6%, a difference of 0.060%), Immigrants from Guatemala (94.6%, a difference of 0.060%), Yakama (94.8%, a difference of 0.10%), and Guatemalan (94.8%, a difference of 0.18%).
| Demographics | Rating | Rank | 5th Grade |
| Immigrants | Latin America | 0.0 /100 | #333 | Tragic 95.3% |
| Nepalese | 0.0 /100 | #334 | Tragic 95.2% |
| Mexicans | 0.0 /100 | #335 | Tragic 95.2% |
| Immigrants | Azores | 0.0 /100 | #336 | Tragic 95.1% |
| Central Americans | 0.0 /100 | #337 | Tragic 95.1% |
| Immigrants | Cabo Verde | 0.0 /100 | #338 | Tragic 94.9% |
| Immigrants | Yemen | 0.0 /100 | #339 | Tragic 94.9% |
| Guatemalans | 0.0 /100 | #340 | Tragic 94.8% |
| Yakama | 0.0 /100 | #341 | Tragic 94.8% |
| Immigrants | Central America | 0.0 /100 | #342 | Tragic 94.7% |
| Salvadorans | 0.0 /100 | #343 | Tragic 94.6% |
| Immigrants | Mexico | 0.0 /100 | #344 | Tragic 94.6% |
| Immigrants | Guatemala | 0.0 /100 | #345 | Tragic 94.6% |
| Immigrants | El Salvador | 0.0 /100 | #346 | Tragic 94.3% |
| Spanish American Indians | 0.0 /100 | #347 | Tragic 94.2% |