Immigrants from Central America vs Immigrants from Korea 5th Grade
COMPARE
Immigrants from Central America
Immigrants from Korea
5th Grade
5th Grade Comparison
Immigrants from Central America
Immigrants from Korea
94.7%
5TH GRADE
0.0/ 100
METRIC RATING
342nd/ 347
METRIC RANK
97.3%
5TH GRADE
54.1/ 100
METRIC RATING
169th/ 347
METRIC RANK
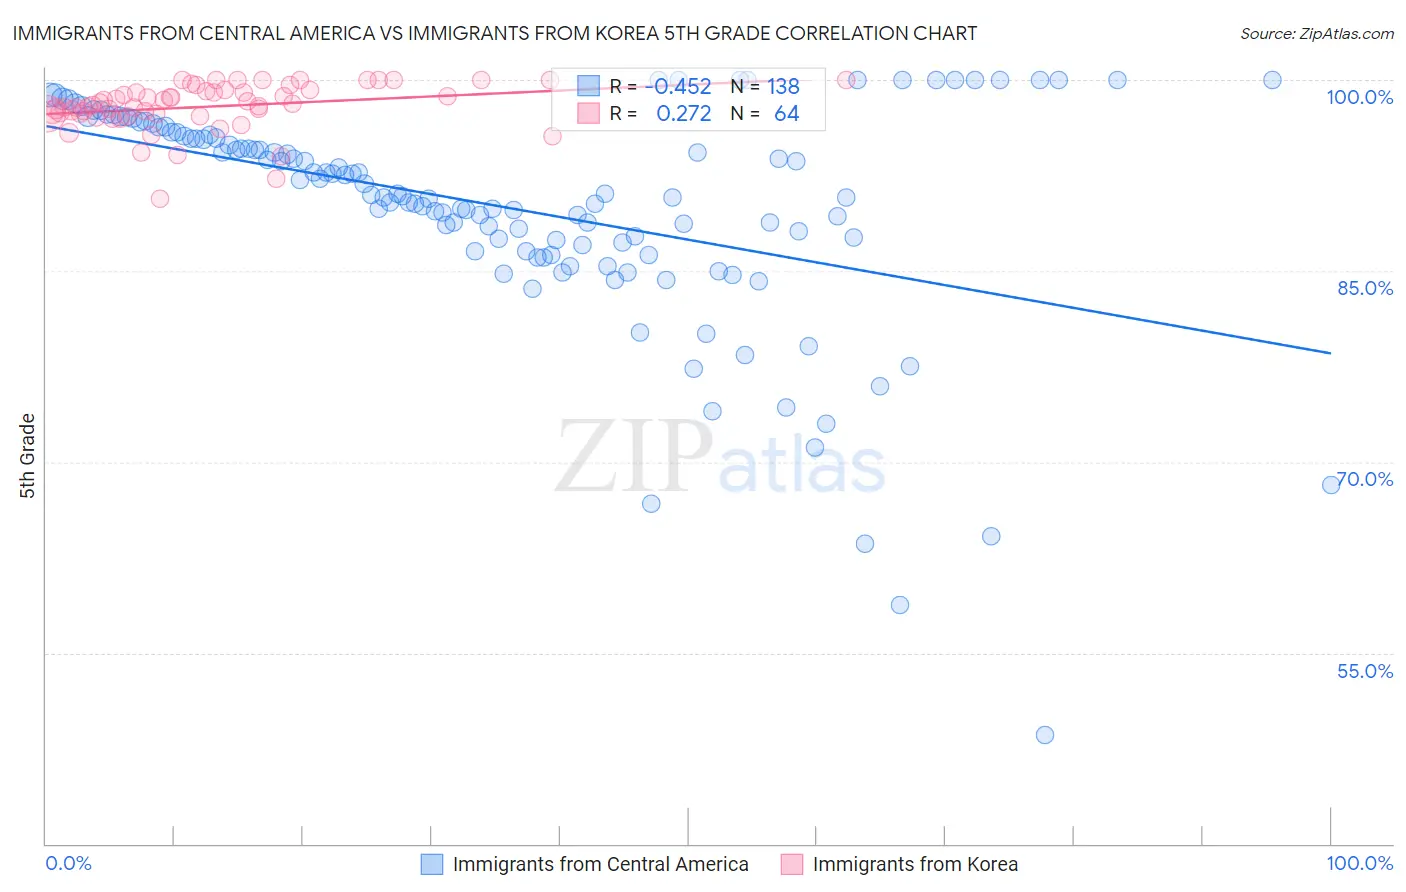
Immigrants from Central America vs Immigrants from Korea 5th Grade Correlation Chart
The statistical analysis conducted on geographies consisting of 536,554,577 people shows a moderate negative correlation between the proportion of Immigrants from Central America and percentage of population with at least 5th grade education in the United States with a correlation coefficient (R) of -0.452 and weighted average of 94.7%. Similarly, the statistical analysis conducted on geographies consisting of 416,280,076 people shows a weak positive correlation between the proportion of Immigrants from Korea and percentage of population with at least 5th grade education in the United States with a correlation coefficient (R) of 0.272 and weighted average of 97.3%, a difference of 2.8%.
5th Grade Correlation Summary
| Measurement | Immigrants from Central America | Immigrants from Korea |
| Minimum | 48.6% | 90.7% |
| Maximum | 100.0% | 100.0% |
| Range | 51.4% | 9.3% |
| Mean | 90.0% | 97.9% |
| Median | 91.0% | 98.1% |
| Interquartile 25% (IQ1) | 87.0% | 97.3% |
| Interquartile 75% (IQ3) | 95.9% | 99.2% |
| Interquartile Range (IQR) | 8.9% | 1.8% |
| Standard Deviation (Sample) | 8.8% | 1.9% |
| Standard Deviation (Population) | 8.8% | 1.9% |
Similar Demographics by 5th Grade
Demographics Similar to Immigrants from Central America by 5th Grade
In terms of 5th grade, the demographic groups most similar to Immigrants from Central America are Salvadoran (94.6%, a difference of 0.060%), Immigrants from Mexico (94.6%, a difference of 0.060%), Immigrants from Guatemala (94.6%, a difference of 0.060%), Yakama (94.8%, a difference of 0.10%), and Guatemalan (94.8%, a difference of 0.18%).
| Demographics | Rating | Rank | 5th Grade |
| Immigrants | Latin America | 0.0 /100 | #333 | Tragic 95.3% |
| Nepalese | 0.0 /100 | #334 | Tragic 95.2% |
| Mexicans | 0.0 /100 | #335 | Tragic 95.2% |
| Immigrants | Azores | 0.0 /100 | #336 | Tragic 95.1% |
| Central Americans | 0.0 /100 | #337 | Tragic 95.1% |
| Immigrants | Cabo Verde | 0.0 /100 | #338 | Tragic 94.9% |
| Immigrants | Yemen | 0.0 /100 | #339 | Tragic 94.9% |
| Guatemalans | 0.0 /100 | #340 | Tragic 94.8% |
| Yakama | 0.0 /100 | #341 | Tragic 94.8% |
| Immigrants | Central America | 0.0 /100 | #342 | Tragic 94.7% |
| Salvadorans | 0.0 /100 | #343 | Tragic 94.6% |
| Immigrants | Mexico | 0.0 /100 | #344 | Tragic 94.6% |
| Immigrants | Guatemala | 0.0 /100 | #345 | Tragic 94.6% |
| Immigrants | El Salvador | 0.0 /100 | #346 | Tragic 94.3% |
| Spanish American Indians | 0.0 /100 | #347 | Tragic 94.2% |
Demographics Similar to Immigrants from Korea by 5th Grade
In terms of 5th grade, the demographic groups most similar to Immigrants from Korea are Immigrants from Belarus (97.3%, a difference of 0.0%), Chilean (97.3%, a difference of 0.0%), Venezuelan (97.3%, a difference of 0.0%), Immigrants from Sri Lanka (97.3%, a difference of 0.0%), and Arab (97.3%, a difference of 0.0%).
| Demographics | Rating | Rank | 5th Grade |
| Immigrants | Iran | 59.5 /100 | #162 | Average 97.4% |
| Ugandans | 58.9 /100 | #163 | Average 97.4% |
| Bermudans | 58.8 /100 | #164 | Average 97.4% |
| Immigrants | Poland | 57.9 /100 | #165 | Average 97.4% |
| Apache | 57.2 /100 | #166 | Average 97.4% |
| Immigrants | Belarus | 54.6 /100 | #167 | Average 97.3% |
| Chileans | 54.5 /100 | #168 | Average 97.3% |
| Immigrants | Korea | 54.1 /100 | #169 | Average 97.3% |
| Venezuelans | 54.0 /100 | #170 | Average 97.3% |
| Immigrants | Sri Lanka | 53.8 /100 | #171 | Average 97.3% |
| Arabs | 53.4 /100 | #172 | Average 97.3% |
| Egyptians | 52.4 /100 | #173 | Average 97.3% |
| Immigrants | Kazakhstan | 50.0 /100 | #174 | Average 97.3% |
| Immigrants | Micronesia | 48.8 /100 | #175 | Average 97.3% |
| Immigrants | Taiwan | 48.4 /100 | #176 | Average 97.3% |