Bahamian vs Blackfeet 7th Grade
COMPARE
Bahamian
Blackfeet
7th Grade
7th Grade Comparison
Bahamians
Blackfeet
95.7%
7TH GRADE
11.6/ 100
METRIC RATING
214th/ 347
METRIC RANK
96.3%
7TH GRADE
83.9/ 100
METRIC RATING
145th/ 347
METRIC RANK
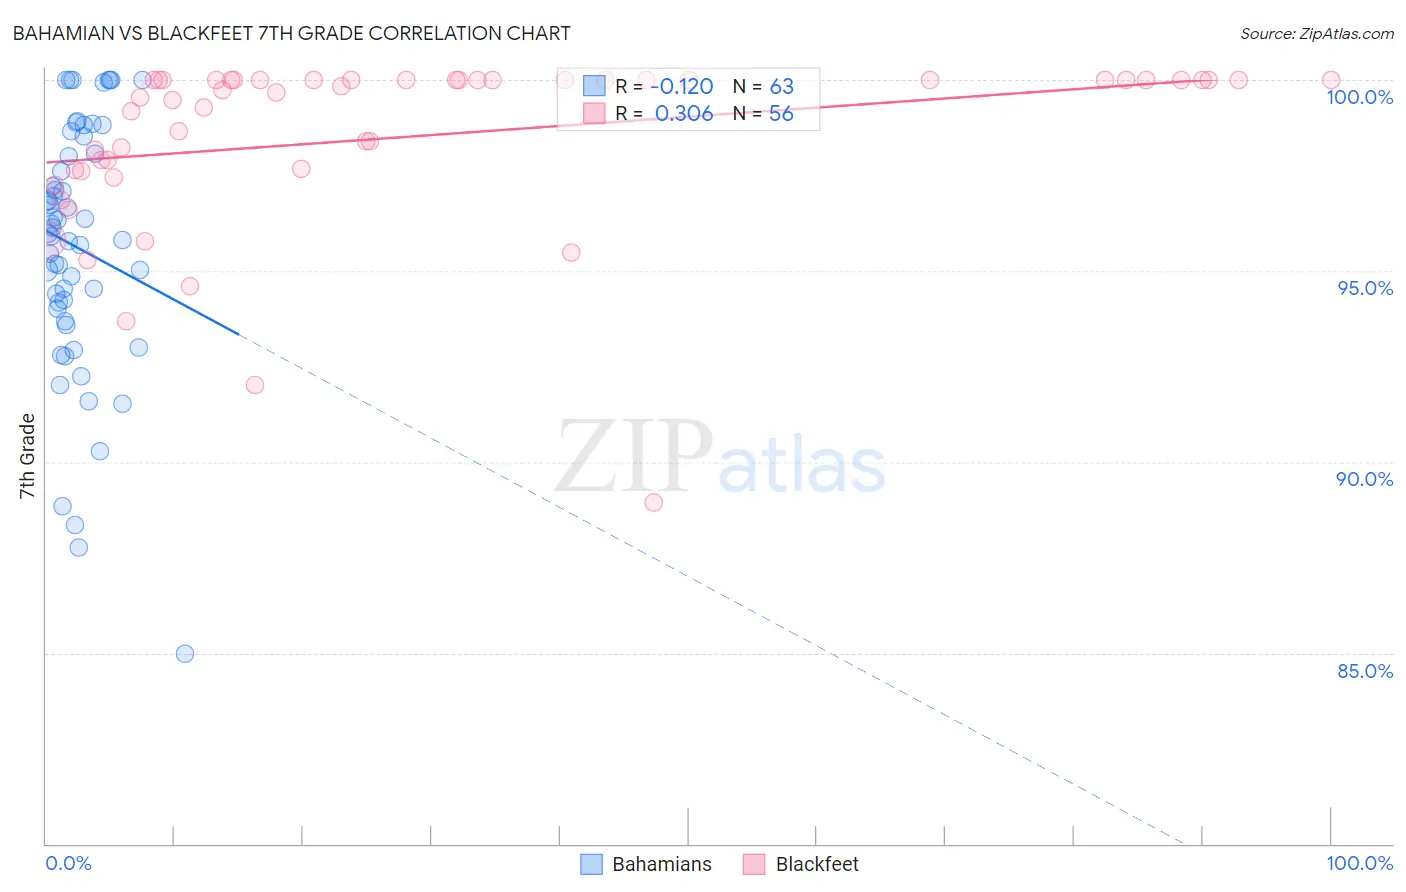
Bahamian vs Blackfeet 7th Grade Correlation Chart
The statistical analysis conducted on geographies consisting of 112,698,819 people shows a poor negative correlation between the proportion of Bahamians and percentage of population with at least 7th grade education in the United States with a correlation coefficient (R) of -0.120 and weighted average of 95.7%. Similarly, the statistical analysis conducted on geographies consisting of 309,580,957 people shows a mild positive correlation between the proportion of Blackfeet and percentage of population with at least 7th grade education in the United States with a correlation coefficient (R) of 0.306 and weighted average of 96.3%, a difference of 0.57%.
7th Grade Correlation Summary
| Measurement | Bahamian | Blackfeet |
| Minimum | 85.0% | 88.9% |
| Maximum | 100.0% | 100.0% |
| Range | 15.0% | 11.1% |
| Mean | 95.6% | 98.5% |
| Median | 96.0% | 99.8% |
| Interquartile 25% (IQ1) | 94.0% | 97.7% |
| Interquartile 75% (IQ3) | 98.1% | 100.0% |
| Interquartile Range (IQR) | 4.1% | 2.3% |
| Standard Deviation (Sample) | 3.3% | 2.3% |
| Standard Deviation (Population) | 3.3% | 2.3% |
Similar Demographics by 7th Grade
Demographics Similar to Bahamians by 7th Grade
In terms of 7th grade, the demographic groups most similar to Bahamians are Immigrants from Morocco (95.8%, a difference of 0.010%), Immigrants from Lebanon (95.8%, a difference of 0.020%), Portuguese (95.8%, a difference of 0.030%), Spanish American (95.7%, a difference of 0.040%), and Immigrants from Chile (95.7%, a difference of 0.040%).
| Demographics | Rating | Rank | 7th Grade |
| Navajo | 17.0 /100 | #207 | Poor 95.8% |
| Immigrants | Sudan | 17.0 /100 | #208 | Poor 95.8% |
| Dutch West Indians | 16.1 /100 | #209 | Poor 95.8% |
| Hawaiians | 16.0 /100 | #210 | Poor 95.8% |
| Portuguese | 13.6 /100 | #211 | Poor 95.8% |
| Immigrants | Lebanon | 13.0 /100 | #212 | Poor 95.8% |
| Immigrants | Morocco | 12.6 /100 | #213 | Poor 95.8% |
| Bahamians | 11.6 /100 | #214 | Poor 95.7% |
| Spanish Americans | 9.3 /100 | #215 | Tragic 95.7% |
| Immigrants | Chile | 9.1 /100 | #216 | Tragic 95.7% |
| Immigrants | Pakistan | 9.0 /100 | #217 | Tragic 95.7% |
| Immigrants | Liberia | 8.1 /100 | #218 | Tragic 95.7% |
| Immigrants | Southern Europe | 7.9 /100 | #219 | Tragic 95.7% |
| Sub-Saharan Africans | 7.2 /100 | #220 | Tragic 95.7% |
| Samoans | 7.0 /100 | #221 | Tragic 95.7% |
Demographics Similar to Blackfeet by 7th Grade
In terms of 7th grade, the demographic groups most similar to Blackfeet are Immigrants from Eastern Europe (96.3%, a difference of 0.0%), French American Indian (96.3%, a difference of 0.010%), Israeli (96.3%, a difference of 0.010%), Albanian (96.3%, a difference of 0.010%), and Immigrants from Greece (96.3%, a difference of 0.020%).
| Demographics | Rating | Rank | 7th Grade |
| Jordanians | 90.0 /100 | #138 | Excellent 96.4% |
| Basques | 89.3 /100 | #139 | Excellent 96.4% |
| Cambodians | 88.3 /100 | #140 | Excellent 96.3% |
| Immigrants | South Central Asia | 87.1 /100 | #141 | Excellent 96.3% |
| Burmese | 87.1 /100 | #142 | Excellent 96.3% |
| Spanish | 86.6 /100 | #143 | Excellent 96.3% |
| Immigrants | Greece | 85.9 /100 | #144 | Excellent 96.3% |
| Blackfeet | 83.9 /100 | #145 | Excellent 96.3% |
| Immigrants | Eastern Europe | 83.7 /100 | #146 | Excellent 96.3% |
| French American Indians | 83.1 /100 | #147 | Excellent 96.3% |
| Israelis | 82.8 /100 | #148 | Excellent 96.3% |
| Albanians | 82.6 /100 | #149 | Excellent 96.3% |
| Immigrants | Belarus | 82.4 /100 | #150 | Excellent 96.3% |
| Hopi | 81.6 /100 | #151 | Excellent 96.3% |
| Immigrants | Russia | 78.4 /100 | #152 | Good 96.2% |