Bahamian vs Immigrants from Indonesia 7th Grade
COMPARE
Bahamian
Immigrants from Indonesia
7th Grade
7th Grade Comparison
Bahamians
Immigrants from Indonesia
95.7%
7TH GRADE
11.6/ 100
METRIC RATING
214th/ 347
METRIC RANK
95.5%
7TH GRADE
3.3/ 100
METRIC RATING
233rd/ 347
METRIC RANK
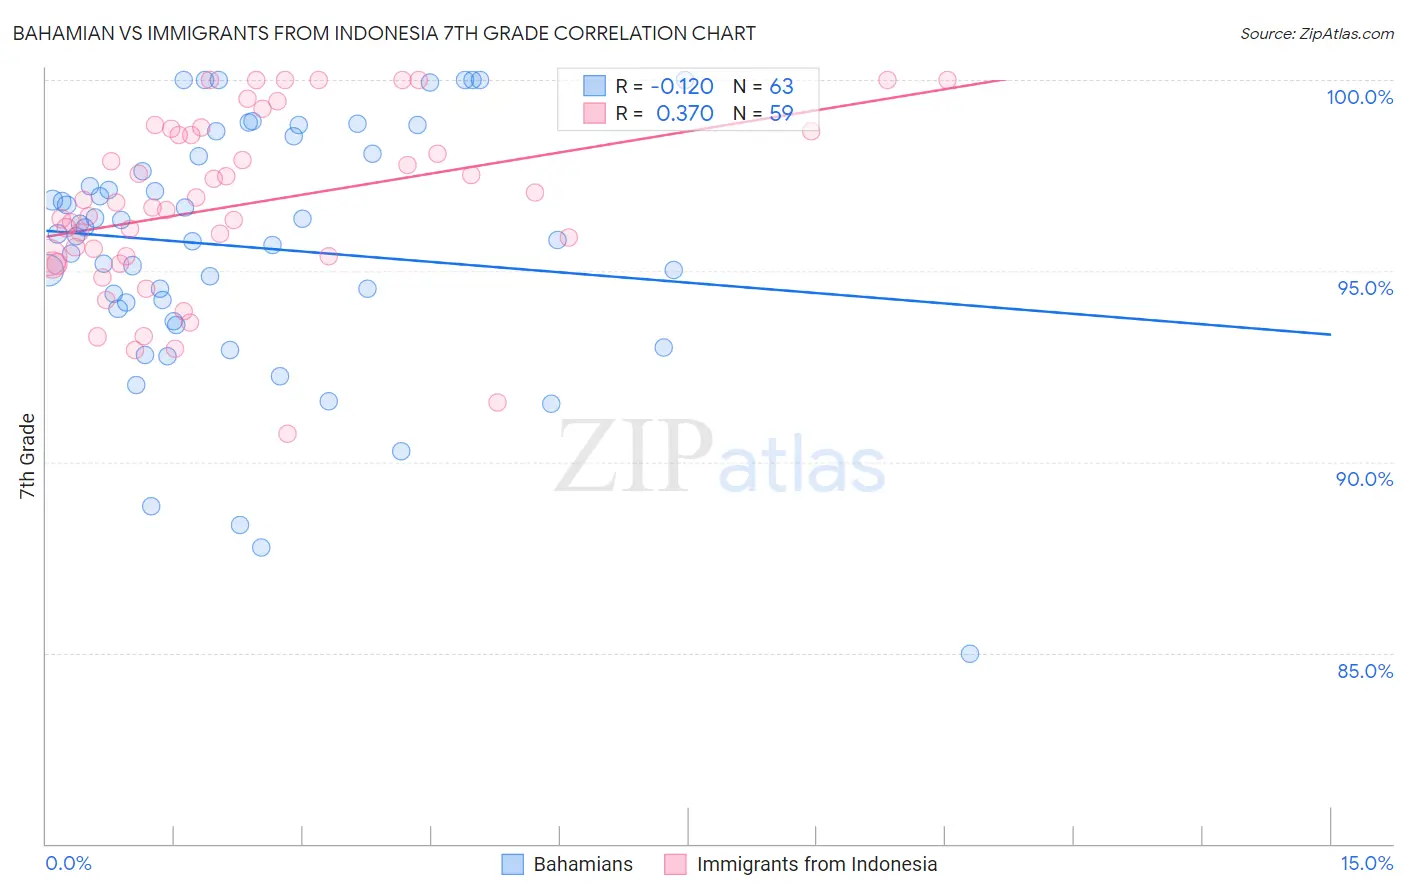
Bahamian vs Immigrants from Indonesia 7th Grade Correlation Chart
The statistical analysis conducted on geographies consisting of 112,698,819 people shows a poor negative correlation between the proportion of Bahamians and percentage of population with at least 7th grade education in the United States with a correlation coefficient (R) of -0.120 and weighted average of 95.7%. Similarly, the statistical analysis conducted on geographies consisting of 215,671,959 people shows a mild positive correlation between the proportion of Immigrants from Indonesia and percentage of population with at least 7th grade education in the United States with a correlation coefficient (R) of 0.370 and weighted average of 95.5%, a difference of 0.21%.
7th Grade Correlation Summary
| Measurement | Bahamian | Immigrants from Indonesia |
| Minimum | 85.0% | 90.7% |
| Maximum | 100.0% | 100.0% |
| Range | 15.0% | 9.3% |
| Mean | 95.6% | 96.7% |
| Median | 96.0% | 96.7% |
| Interquartile 25% (IQ1) | 94.0% | 95.4% |
| Interquartile 75% (IQ3) | 98.1% | 98.7% |
| Interquartile Range (IQR) | 4.1% | 3.3% |
| Standard Deviation (Sample) | 3.3% | 2.3% |
| Standard Deviation (Population) | 3.3% | 2.3% |
Demographics Similar to Bahamians and Immigrants from Indonesia by 7th Grade
In terms of 7th grade, the demographic groups most similar to Bahamians are Immigrants from Morocco (95.8%, a difference of 0.010%), Spanish American (95.7%, a difference of 0.040%), Immigrants from Chile (95.7%, a difference of 0.040%), Immigrants from Pakistan (95.7%, a difference of 0.040%), and Immigrants from Liberia (95.7%, a difference of 0.060%). Similarly, the demographic groups most similar to Immigrants from Indonesia are Costa Rican (95.5%, a difference of 0.0%), Senegalese (95.6%, a difference of 0.030%), Native/Alaskan (95.6%, a difference of 0.040%), Immigrants from Eastern Africa (95.6%, a difference of 0.070%), and Immigrants from Panama (95.6%, a difference of 0.070%).
| Demographics | Rating | Rank | 7th Grade |
| Immigrants | Morocco | 12.6 /100 | #213 | Poor 95.8% |
| Bahamians | 11.6 /100 | #214 | Poor 95.7% |
| Spanish Americans | 9.3 /100 | #215 | Tragic 95.7% |
| Immigrants | Chile | 9.1 /100 | #216 | Tragic 95.7% |
| Immigrants | Pakistan | 9.0 /100 | #217 | Tragic 95.7% |
| Immigrants | Liberia | 8.1 /100 | #218 | Tragic 95.7% |
| Immigrants | Southern Europe | 7.9 /100 | #219 | Tragic 95.7% |
| Sub-Saharan Africans | 7.2 /100 | #220 | Tragic 95.7% |
| Samoans | 7.0 /100 | #221 | Tragic 95.7% |
| Laotians | 6.8 /100 | #222 | Tragic 95.7% |
| Immigrants | Syria | 6.7 /100 | #223 | Tragic 95.7% |
| Immigrants | Oceania | 6.7 /100 | #224 | Tragic 95.7% |
| Immigrants | Malaysia | 6.2 /100 | #225 | Tragic 95.6% |
| Immigrants | Eastern Asia | 5.8 /100 | #226 | Tragic 95.6% |
| Immigrants | Western Asia | 5.4 /100 | #227 | Tragic 95.6% |
| Immigrants | Eastern Africa | 5.1 /100 | #228 | Tragic 95.6% |
| Immigrants | Panama | 4.9 /100 | #229 | Tragic 95.6% |
| Natives/Alaskans | 4.2 /100 | #230 | Tragic 95.6% |
| Senegalese | 4.0 /100 | #231 | Tragic 95.6% |
| Costa Ricans | 3.3 /100 | #232 | Tragic 95.5% |
| Immigrants | Indonesia | 3.3 /100 | #233 | Tragic 95.5% |