Bahamian vs Navajo 7th Grade
COMPARE
Bahamian
Navajo
7th Grade
7th Grade Comparison
Bahamians
Navajo
95.7%
7TH GRADE
11.6/ 100
METRIC RATING
214th/ 347
METRIC RANK
95.8%
7TH GRADE
17.0/ 100
METRIC RATING
207th/ 347
METRIC RANK
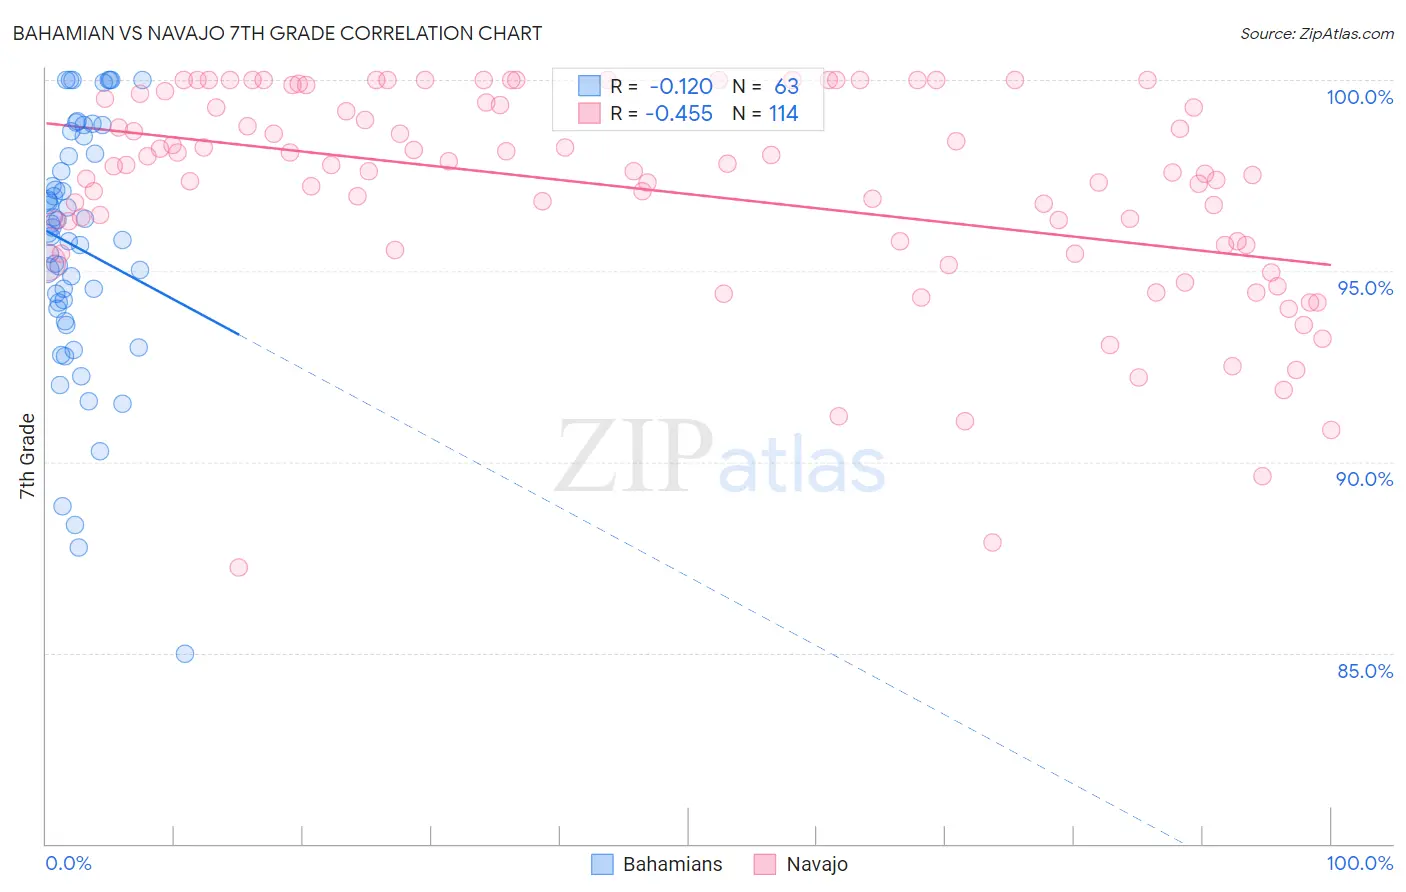
Bahamian vs Navajo 7th Grade Correlation Chart
The statistical analysis conducted on geographies consisting of 112,698,819 people shows a poor negative correlation between the proportion of Bahamians and percentage of population with at least 7th grade education in the United States with a correlation coefficient (R) of -0.120 and weighted average of 95.7%. Similarly, the statistical analysis conducted on geographies consisting of 224,871,965 people shows a moderate negative correlation between the proportion of Navajo and percentage of population with at least 7th grade education in the United States with a correlation coefficient (R) of -0.455 and weighted average of 95.8%, a difference of 0.070%.
7th Grade Correlation Summary
| Measurement | Bahamian | Navajo |
| Minimum | 85.0% | 87.2% |
| Maximum | 100.0% | 100.0% |
| Range | 15.0% | 12.8% |
| Mean | 95.6% | 97.1% |
| Median | 96.0% | 97.6% |
| Interquartile 25% (IQ1) | 94.0% | 95.7% |
| Interquartile 75% (IQ3) | 98.1% | 99.4% |
| Interquartile Range (IQR) | 4.1% | 3.7% |
| Standard Deviation (Sample) | 3.3% | 2.8% |
| Standard Deviation (Population) | 3.3% | 2.8% |
Demographics Similar to Bahamians and Navajo by 7th Grade
In terms of 7th grade, the demographic groups most similar to Bahamians are Immigrants from Morocco (95.8%, a difference of 0.010%), Immigrants from Lebanon (95.8%, a difference of 0.020%), Portuguese (95.8%, a difference of 0.030%), Spanish American (95.7%, a difference of 0.040%), and Immigrants from Chile (95.7%, a difference of 0.040%). Similarly, the demographic groups most similar to Navajo are Immigrants from Sudan (95.8%, a difference of 0.0%), African (95.8%, a difference of 0.010%), Dutch West Indian (95.8%, a difference of 0.010%), Hawaiian (95.8%, a difference of 0.010%), and Moroccan (95.8%, a difference of 0.020%).
| Demographics | Rating | Rank | 7th Grade |
| Argentineans | 23.2 /100 | #200 | Fair 95.9% |
| Immigrants | Argentina | 21.9 /100 | #201 | Fair 95.9% |
| Immigrants | Northern Africa | 21.4 /100 | #202 | Fair 95.8% |
| Comanche | 21.1 /100 | #203 | Fair 95.8% |
| Assyrians/Chaldeans/Syriacs | 20.5 /100 | #204 | Fair 95.8% |
| Moroccans | 18.9 /100 | #205 | Poor 95.8% |
| Africans | 17.6 /100 | #206 | Poor 95.8% |
| Navajo | 17.0 /100 | #207 | Poor 95.8% |
| Immigrants | Sudan | 17.0 /100 | #208 | Poor 95.8% |
| Dutch West Indians | 16.1 /100 | #209 | Poor 95.8% |
| Hawaiians | 16.0 /100 | #210 | Poor 95.8% |
| Portuguese | 13.6 /100 | #211 | Poor 95.8% |
| Immigrants | Lebanon | 13.0 /100 | #212 | Poor 95.8% |
| Immigrants | Morocco | 12.6 /100 | #213 | Poor 95.8% |
| Bahamians | 11.6 /100 | #214 | Poor 95.7% |
| Spanish Americans | 9.3 /100 | #215 | Tragic 95.7% |
| Immigrants | Chile | 9.1 /100 | #216 | Tragic 95.7% |
| Immigrants | Pakistan | 9.0 /100 | #217 | Tragic 95.7% |
| Immigrants | Liberia | 8.1 /100 | #218 | Tragic 95.7% |
| Immigrants | Southern Europe | 7.9 /100 | #219 | Tragic 95.7% |
| Sub-Saharan Africans | 7.2 /100 | #220 | Tragic 95.7% |