Bahamian vs Immigrants from France 7th Grade
COMPARE
Bahamian
Immigrants from France
7th Grade
7th Grade Comparison
Bahamians
Immigrants from France
95.7%
7TH GRADE
11.6/ 100
METRIC RATING
214th/ 347
METRIC RANK
96.5%
7TH GRADE
94.7/ 100
METRIC RATING
123rd/ 347
METRIC RANK
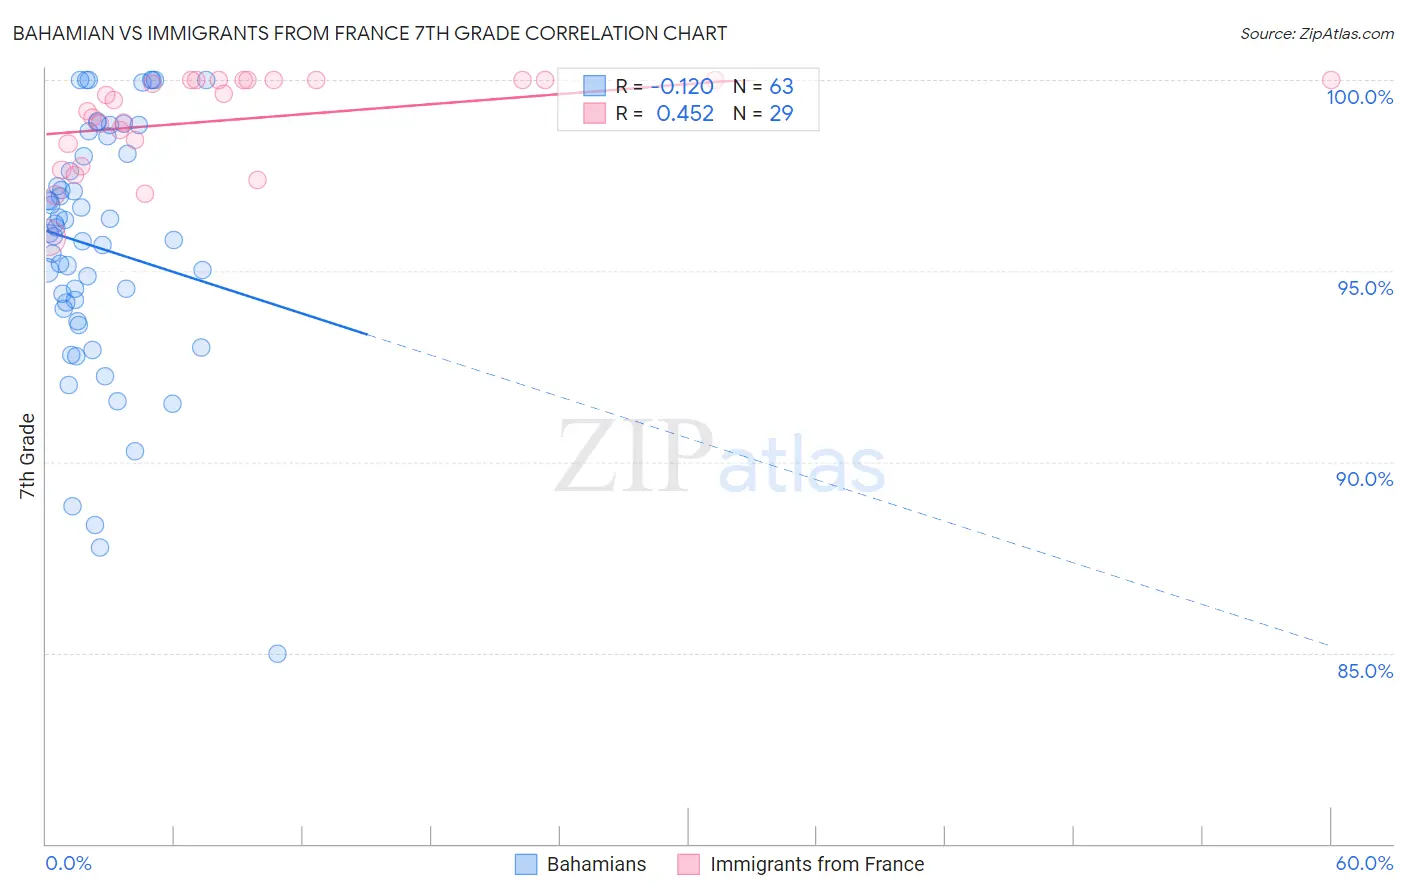
Bahamian vs Immigrants from France 7th Grade Correlation Chart
The statistical analysis conducted on geographies consisting of 112,698,819 people shows a poor negative correlation between the proportion of Bahamians and percentage of population with at least 7th grade education in the United States with a correlation coefficient (R) of -0.120 and weighted average of 95.7%. Similarly, the statistical analysis conducted on geographies consisting of 287,919,934 people shows a moderate positive correlation between the proportion of Immigrants from France and percentage of population with at least 7th grade education in the United States with a correlation coefficient (R) of 0.452 and weighted average of 96.5%, a difference of 0.75%.
7th Grade Correlation Summary
| Measurement | Bahamian | Immigrants from France |
| Minimum | 85.0% | 95.9% |
| Maximum | 100.0% | 100.0% |
| Range | 15.0% | 4.1% |
| Mean | 95.6% | 99.0% |
| Median | 96.0% | 99.5% |
| Interquartile 25% (IQ1) | 94.0% | 98.0% |
| Interquartile 75% (IQ3) | 98.1% | 100.0% |
| Interquartile Range (IQR) | 4.1% | 2.0% |
| Standard Deviation (Sample) | 3.3% | 1.2% |
| Standard Deviation (Population) | 3.3% | 1.2% |
Similar Demographics by 7th Grade
Demographics Similar to Bahamians by 7th Grade
In terms of 7th grade, the demographic groups most similar to Bahamians are Immigrants from Morocco (95.8%, a difference of 0.010%), Immigrants from Lebanon (95.8%, a difference of 0.020%), Portuguese (95.8%, a difference of 0.030%), Spanish American (95.7%, a difference of 0.040%), and Immigrants from Chile (95.7%, a difference of 0.040%).
| Demographics | Rating | Rank | 7th Grade |
| Navajo | 17.0 /100 | #207 | Poor 95.8% |
| Immigrants | Sudan | 17.0 /100 | #208 | Poor 95.8% |
| Dutch West Indians | 16.1 /100 | #209 | Poor 95.8% |
| Hawaiians | 16.0 /100 | #210 | Poor 95.8% |
| Portuguese | 13.6 /100 | #211 | Poor 95.8% |
| Immigrants | Lebanon | 13.0 /100 | #212 | Poor 95.8% |
| Immigrants | Morocco | 12.6 /100 | #213 | Poor 95.8% |
| Bahamians | 11.6 /100 | #214 | Poor 95.7% |
| Spanish Americans | 9.3 /100 | #215 | Tragic 95.7% |
| Immigrants | Chile | 9.1 /100 | #216 | Tragic 95.7% |
| Immigrants | Pakistan | 9.0 /100 | #217 | Tragic 95.7% |
| Immigrants | Liberia | 8.1 /100 | #218 | Tragic 95.7% |
| Immigrants | Southern Europe | 7.9 /100 | #219 | Tragic 95.7% |
| Sub-Saharan Africans | 7.2 /100 | #220 | Tragic 95.7% |
| Samoans | 7.0 /100 | #221 | Tragic 95.7% |
Demographics Similar to Immigrants from France by 7th Grade
In terms of 7th grade, the demographic groups most similar to Immigrants from France are Immigrants from Europe (96.5%, a difference of 0.0%), Immigrants from Croatia (96.5%, a difference of 0.010%), Cheyenne (96.5%, a difference of 0.010%), Immigrants from Switzerland (96.5%, a difference of 0.010%), and Immigrants from Norway (96.5%, a difference of 0.020%).
| Demographics | Rating | Rank | 7th Grade |
| Syrians | 96.6 /100 | #116 | Exceptional 96.5% |
| Immigrants | Moldova | 95.7 /100 | #117 | Exceptional 96.5% |
| Immigrants | Japan | 95.5 /100 | #118 | Exceptional 96.5% |
| Immigrants | Norway | 95.2 /100 | #119 | Exceptional 96.5% |
| Immigrants | Croatia | 95.0 /100 | #120 | Exceptional 96.5% |
| Cheyenne | 94.9 /100 | #121 | Exceptional 96.5% |
| Immigrants | Europe | 94.8 /100 | #122 | Exceptional 96.5% |
| Immigrants | France | 94.7 /100 | #123 | Exceptional 96.5% |
| Immigrants | Switzerland | 94.5 /100 | #124 | Exceptional 96.5% |
| Immigrants | Bulgaria | 94.0 /100 | #125 | Exceptional 96.4% |
| Palestinians | 93.5 /100 | #126 | Exceptional 96.4% |
| Immigrants | Bosnia and Herzegovina | 93.3 /100 | #127 | Exceptional 96.4% |
| Immigrants | Romania | 93.2 /100 | #128 | Exceptional 96.4% |
| Immigrants | North Macedonia | 93.1 /100 | #129 | Exceptional 96.4% |
| Immigrants | Serbia | 92.8 /100 | #130 | Exceptional 96.4% |