Cape Verdean vs Welsh 11th Grade
COMPARE
Cape Verdean
Welsh
11th Grade
11th Grade Comparison
Cape Verdeans
Welsh
89.1%
11TH GRADE
0.0/ 100
METRIC RATING
314th/ 347
METRIC RANK
94.2%
11TH GRADE
99.9/ 100
METRIC RATING
31st/ 347
METRIC RANK
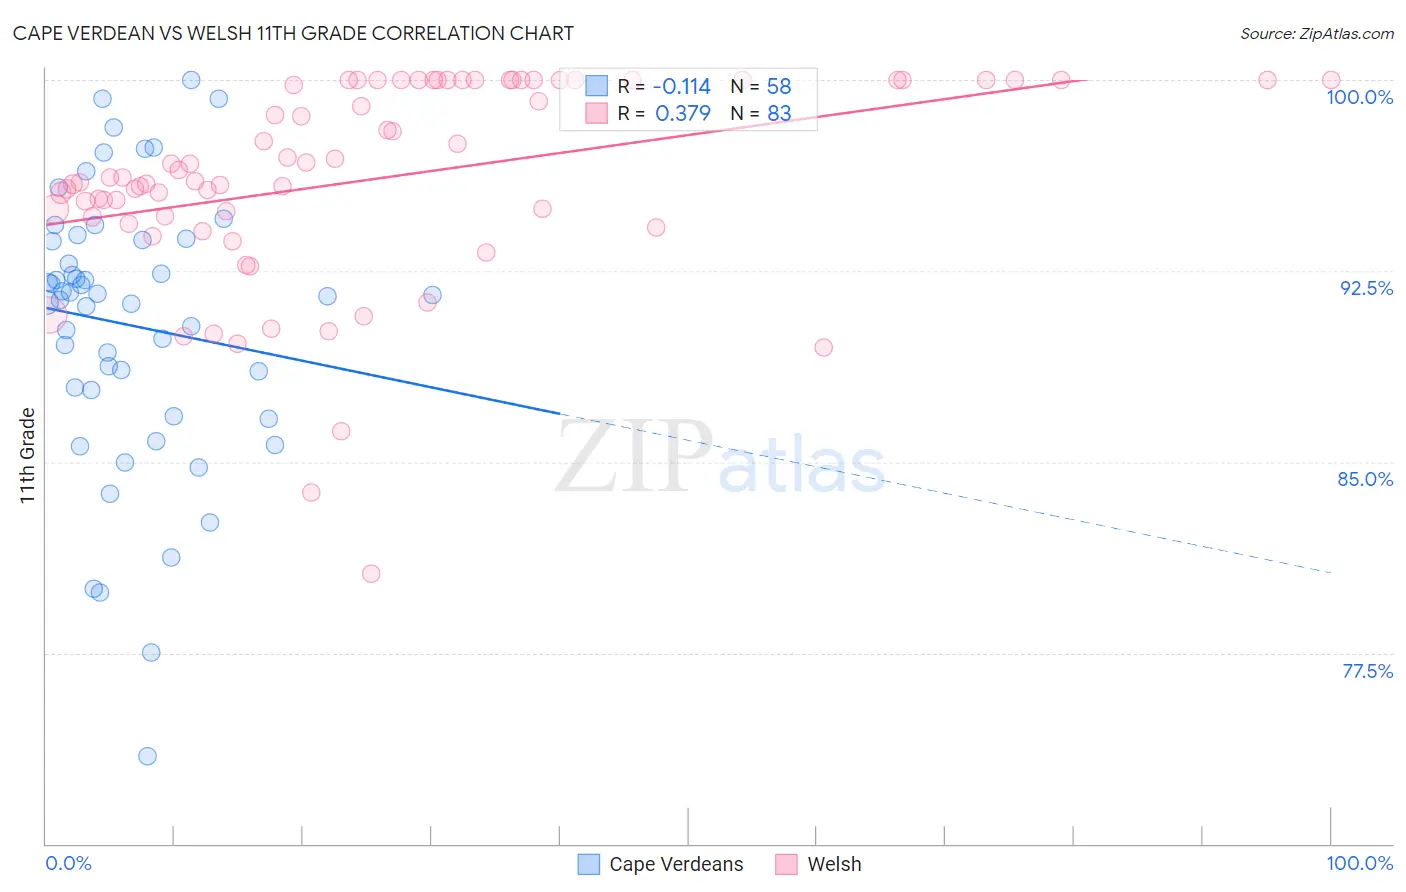
Cape Verdean vs Welsh 11th Grade Correlation Chart
The statistical analysis conducted on geographies consisting of 107,537,955 people shows a poor negative correlation between the proportion of Cape Verdeans and percentage of population with at least 11th grade education in the United States with a correlation coefficient (R) of -0.114 and weighted average of 89.1%. Similarly, the statistical analysis conducted on geographies consisting of 528,596,196 people shows a mild positive correlation between the proportion of Welsh and percentage of population with at least 11th grade education in the United States with a correlation coefficient (R) of 0.379 and weighted average of 94.2%, a difference of 5.8%.
11th Grade Correlation Summary
| Measurement | Cape Verdean | Welsh |
| Minimum | 73.5% | 80.6% |
| Maximum | 100.0% | 100.0% |
| Range | 26.5% | 19.4% |
| Mean | 90.4% | 96.1% |
| Median | 91.5% | 96.2% |
| Interquartile 25% (IQ1) | 87.8% | 94.6% |
| Interquartile 75% (IQ3) | 93.7% | 100.0% |
| Interquartile Range (IQR) | 5.9% | 5.4% |
| Standard Deviation (Sample) | 5.4% | 4.0% |
| Standard Deviation (Population) | 5.4% | 4.0% |
Similar Demographics by 11th Grade
Demographics Similar to Cape Verdeans by 11th Grade
In terms of 11th grade, the demographic groups most similar to Cape Verdeans are Immigrants from Ecuador (89.1%, a difference of 0.010%), Immigrants from Caribbean (89.1%, a difference of 0.020%), Immigrants from Cuba (88.9%, a difference of 0.16%), Lumbee (88.9%, a difference of 0.17%), and Immigrants from Portugal (89.3%, a difference of 0.22%).
| Demographics | Rating | Rank | 11th Grade |
| Immigrants | Dominica | 0.0 /100 | #307 | Tragic 89.5% |
| Nepalese | 0.0 /100 | #308 | Tragic 89.5% |
| Immigrants | Bangladesh | 0.0 /100 | #309 | Tragic 89.5% |
| Yaqui | 0.0 /100 | #310 | Tragic 89.5% |
| Vietnamese | 0.0 /100 | #311 | Tragic 89.4% |
| Immigrants | Portugal | 0.0 /100 | #312 | Tragic 89.3% |
| Immigrants | Caribbean | 0.0 /100 | #313 | Tragic 89.1% |
| Cape Verdeans | 0.0 /100 | #314 | Tragic 89.1% |
| Immigrants | Ecuador | 0.0 /100 | #315 | Tragic 89.1% |
| Immigrants | Cuba | 0.0 /100 | #316 | Tragic 88.9% |
| Lumbee | 0.0 /100 | #317 | Tragic 88.9% |
| Nicaraguans | 0.0 /100 | #318 | Tragic 88.9% |
| Belizeans | 0.0 /100 | #319 | Tragic 88.8% |
| Immigrants | Armenia | 0.0 /100 | #320 | Tragic 88.8% |
| Immigrants | Belize | 0.0 /100 | #321 | Tragic 88.7% |
Demographics Similar to Welsh by 11th Grade
In terms of 11th grade, the demographic groups most similar to Welsh are Belgian (94.2%, a difference of 0.0%), Russian (94.3%, a difference of 0.020%), British (94.2%, a difference of 0.040%), Immigrants from Scotland (94.2%, a difference of 0.040%), and Immigrants from Singapore (94.2%, a difference of 0.050%).
| Demographics | Rating | Rank | 11th Grade |
| English | 100.0 /100 | #24 | Exceptional 94.4% |
| Irish | 100.0 /100 | #25 | Exceptional 94.4% |
| Scottish | 100.0 /100 | #26 | Exceptional 94.4% |
| Europeans | 100.0 /100 | #27 | Exceptional 94.4% |
| Estonians | 100.0 /100 | #28 | Exceptional 94.4% |
| Dutch | 100.0 /100 | #29 | Exceptional 94.3% |
| Russians | 100.0 /100 | #30 | Exceptional 94.3% |
| Welsh | 99.9 /100 | #31 | Exceptional 94.2% |
| Belgians | 99.9 /100 | #32 | Exceptional 94.2% |
| British | 99.9 /100 | #33 | Exceptional 94.2% |
| Immigrants | Scotland | 99.9 /100 | #34 | Exceptional 94.2% |
| Immigrants | Singapore | 99.9 /100 | #35 | Exceptional 94.2% |
| Immigrants | Northern Europe | 99.9 /100 | #36 | Exceptional 94.2% |
| Northern Europeans | 99.9 /100 | #37 | Exceptional 94.2% |
| Hungarians | 99.9 /100 | #38 | Exceptional 94.2% |