Immigrants from Sudan vs Syrian College, 1 year or more
COMPARE
Immigrants from Sudan
Syrian
College, 1 year or more
College, 1 year or more Comparison
Immigrants from Sudan
Syrians
60.4%
COLLEGE, 1 YEAR OR MORE
77.8/ 100
METRIC RATING
150th/ 347
METRIC RANK
61.9%
COLLEGE, 1 YEAR OR MORE
95.7/ 100
METRIC RATING
108th/ 347
METRIC RANK
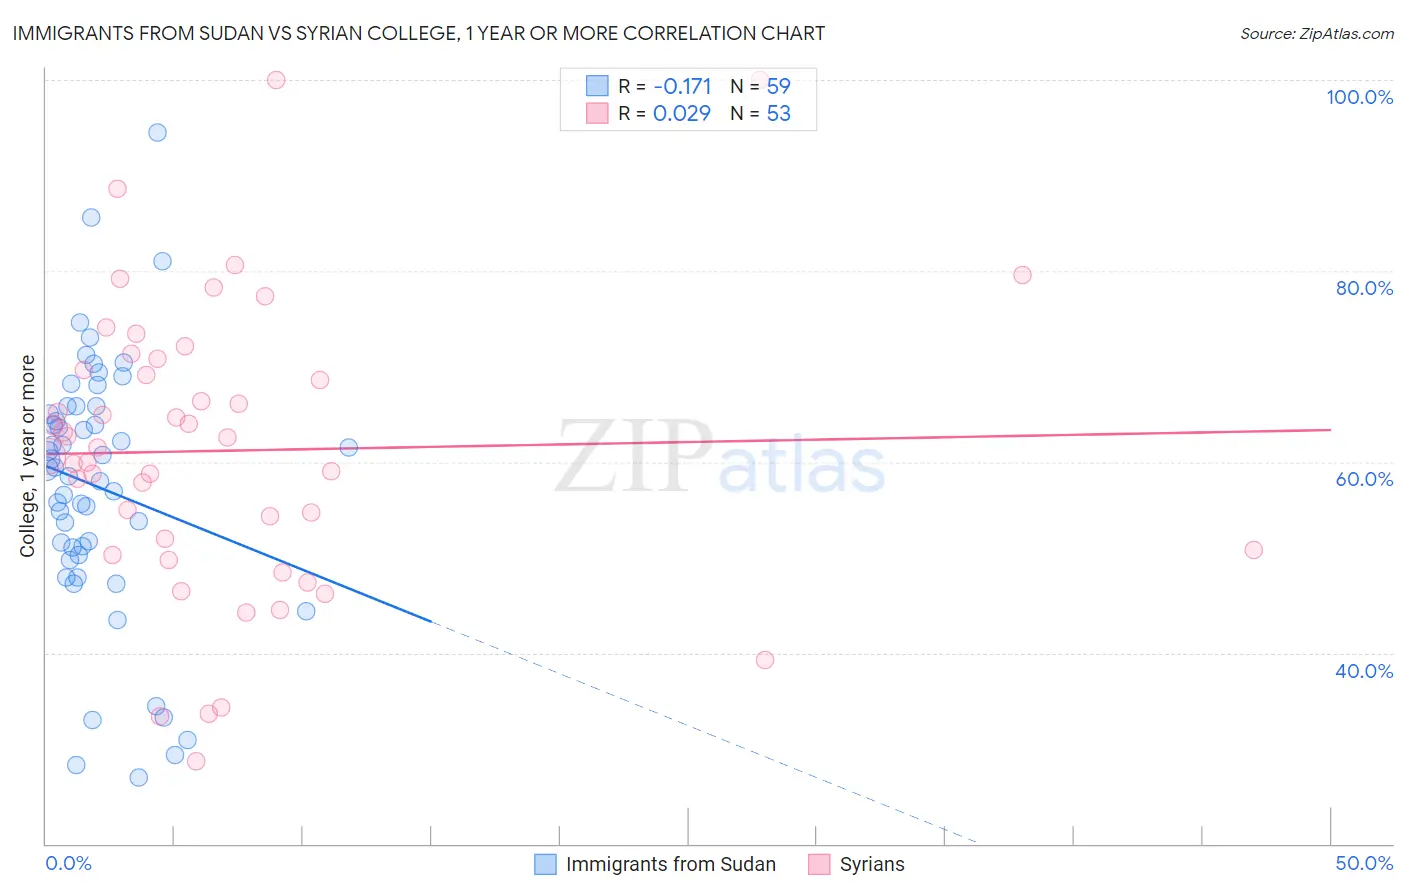
Immigrants from Sudan vs Syrian College, 1 year or more Correlation Chart
The statistical analysis conducted on geographies consisting of 118,973,526 people shows a poor negative correlation between the proportion of Immigrants from Sudan and percentage of population with at least college, 1 year or more education in the United States with a correlation coefficient (R) of -0.171 and weighted average of 60.4%. Similarly, the statistical analysis conducted on geographies consisting of 266,306,496 people shows no correlation between the proportion of Syrians and percentage of population with at least college, 1 year or more education in the United States with a correlation coefficient (R) of 0.029 and weighted average of 61.9%, a difference of 2.4%.
College, 1 year or more Correlation Summary
| Measurement | Immigrants from Sudan | Syrian |
| Minimum | 27.0% | 28.6% |
| Maximum | 94.5% | 100.0% |
| Range | 67.5% | 71.4% |
| Mean | 57.3% | 61.2% |
| Median | 59.3% | 61.5% |
| Interquartile 25% (IQ1) | 50.2% | 50.5% |
| Interquartile 75% (IQ3) | 65.8% | 70.2% |
| Interquartile Range (IQR) | 15.6% | 19.7% |
| Standard Deviation (Sample) | 13.7% | 15.2% |
| Standard Deviation (Population) | 13.6% | 15.1% |
Similar Demographics by College, 1 year or more
Demographics Similar to Immigrants from Sudan by College, 1 year or more
In terms of college, 1 year or more, the demographic groups most similar to Immigrants from Sudan are Albanian (60.4%, a difference of 0.0%), Kenyan (60.5%, a difference of 0.090%), Brazilian (60.5%, a difference of 0.090%), Immigrants from Kenya (60.5%, a difference of 0.10%), and Immigrants from Germany (60.3%, a difference of 0.13%).
| Demographics | Rating | Rank | College, 1 year or more |
| Canadians | 82.7 /100 | #143 | Excellent 60.6% |
| Czechs | 81.9 /100 | #144 | Excellent 60.6% |
| Slavs | 81.1 /100 | #145 | Excellent 60.6% |
| Scottish | 80.2 /100 | #146 | Excellent 60.5% |
| Immigrants | Kenya | 79.1 /100 | #147 | Good 60.5% |
| Kenyans | 79.0 /100 | #148 | Good 60.5% |
| Brazilians | 79.0 /100 | #149 | Good 60.5% |
| Immigrants | Sudan | 77.8 /100 | #150 | Good 60.4% |
| Albanians | 77.8 /100 | #151 | Good 60.4% |
| Immigrants | Germany | 76.1 /100 | #152 | Good 60.3% |
| Sierra Leoneans | 74.1 /100 | #153 | Good 60.2% |
| Sudanese | 73.0 /100 | #154 | Good 60.2% |
| Moroccans | 72.9 /100 | #155 | Good 60.2% |
| Finns | 72.9 /100 | #156 | Good 60.2% |
| Immigrants | Armenia | 68.8 /100 | #157 | Good 60.0% |
Demographics Similar to Syrians by College, 1 year or more
In terms of college, 1 year or more, the demographic groups most similar to Syrians are Immigrants from Northern Africa (61.9%, a difference of 0.0%), Immigrants from Ukraine (61.9%, a difference of 0.020%), European (61.8%, a difference of 0.020%), Macedonian (61.8%, a difference of 0.020%), and Austrian (61.8%, a difference of 0.080%).
| Demographics | Rating | Rank | College, 1 year or more |
| Swedes | 96.8 /100 | #101 | Exceptional 62.1% |
| Luxembourgers | 96.7 /100 | #102 | Exceptional 62.1% |
| Afghans | 96.4 /100 | #103 | Exceptional 62.0% |
| Chileans | 96.4 /100 | #104 | Exceptional 62.0% |
| Immigrants | Nepal | 96.3 /100 | #105 | Exceptional 62.0% |
| Palestinians | 96.3 /100 | #106 | Exceptional 62.0% |
| Immigrants | Ukraine | 95.8 /100 | #107 | Exceptional 61.9% |
| Syrians | 95.7 /100 | #108 | Exceptional 61.9% |
| Immigrants | Northern Africa | 95.7 /100 | #109 | Exceptional 61.9% |
| Europeans | 95.6 /100 | #110 | Exceptional 61.8% |
| Macedonians | 95.6 /100 | #111 | Exceptional 61.8% |
| Austrians | 95.4 /100 | #112 | Exceptional 61.8% |
| Ukrainians | 95.2 /100 | #113 | Exceptional 61.8% |
| Danes | 94.8 /100 | #114 | Exceptional 61.7% |
| Norwegians | 94.5 /100 | #115 | Exceptional 61.7% |