Fijian vs Syrian College, 1 year or more
COMPARE
Fijian
Syrian
College, 1 year or more
College, 1 year or more Comparison
Fijians
Syrians
51.3%
COLLEGE, 1 YEAR OR MORE
0.0/ 100
METRIC RATING
314th/ 347
METRIC RANK
61.9%
COLLEGE, 1 YEAR OR MORE
95.7/ 100
METRIC RATING
108th/ 347
METRIC RANK
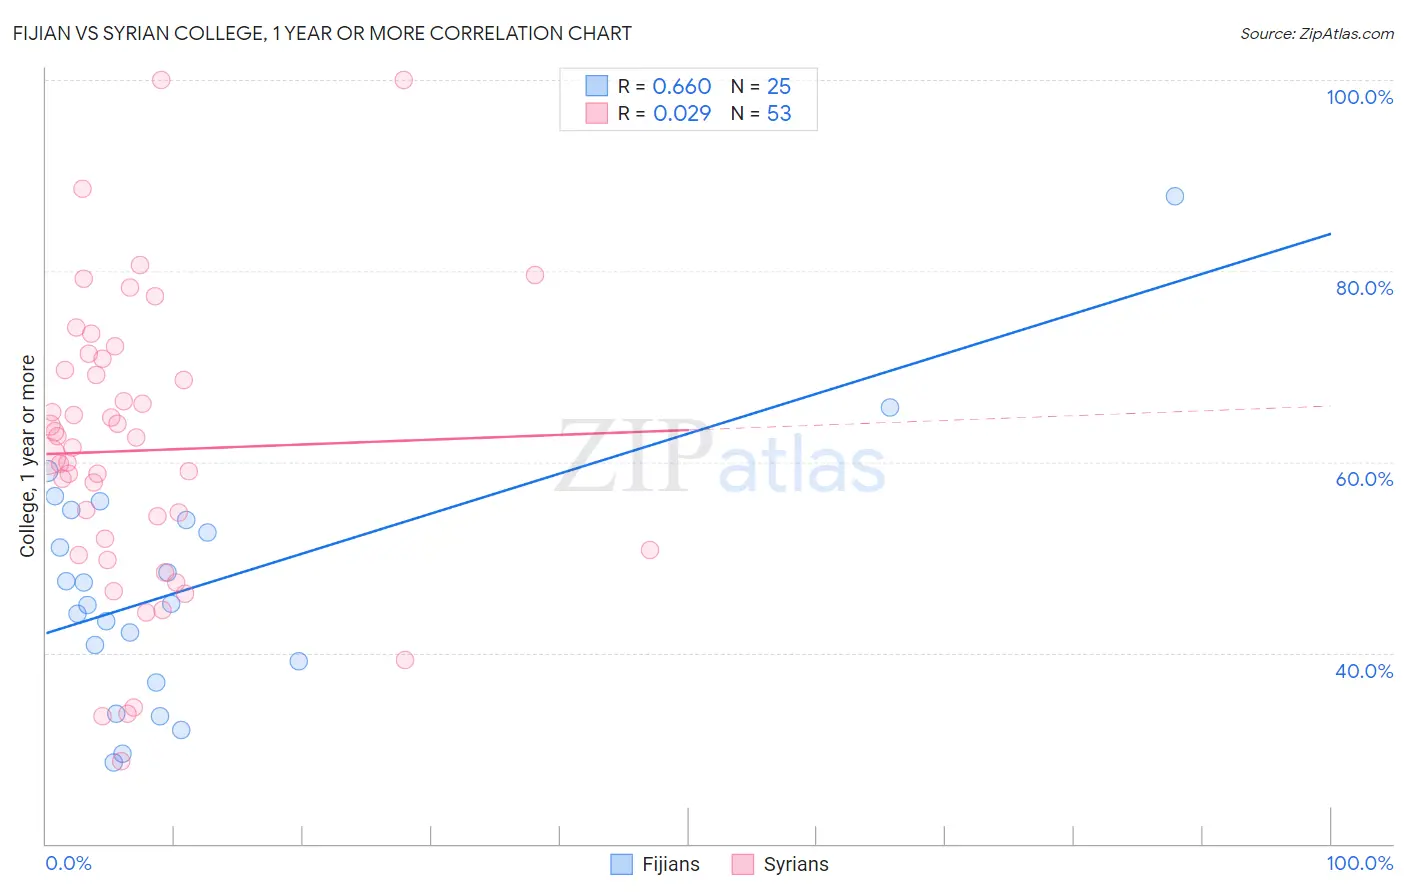
Fijian vs Syrian College, 1 year or more Correlation Chart
The statistical analysis conducted on geographies consisting of 55,948,842 people shows a significant positive correlation between the proportion of Fijians and percentage of population with at least college, 1 year or more education in the United States with a correlation coefficient (R) of 0.660 and weighted average of 51.3%. Similarly, the statistical analysis conducted on geographies consisting of 266,306,496 people shows no correlation between the proportion of Syrians and percentage of population with at least college, 1 year or more education in the United States with a correlation coefficient (R) of 0.029 and weighted average of 61.9%, a difference of 20.5%.
College, 1 year or more Correlation Summary
| Measurement | Fijian | Syrian |
| Minimum | 28.6% | 28.6% |
| Maximum | 87.8% | 100.0% |
| Range | 59.3% | 71.4% |
| Mean | 47.0% | 61.2% |
| Median | 45.2% | 61.5% |
| Interquartile 25% (IQ1) | 38.0% | 50.5% |
| Interquartile 75% (IQ3) | 54.4% | 70.2% |
| Interquartile Range (IQR) | 16.4% | 19.7% |
| Standard Deviation (Sample) | 12.9% | 15.2% |
| Standard Deviation (Population) | 12.6% | 15.1% |
Similar Demographics by College, 1 year or more
Demographics Similar to Fijians by College, 1 year or more
In terms of college, 1 year or more, the demographic groups most similar to Fijians are Immigrants from Caribbean (51.4%, a difference of 0.22%), Guatemalan (51.2%, a difference of 0.23%), Cajun (51.2%, a difference of 0.30%), Pueblo (51.5%, a difference of 0.35%), and Immigrants from Haiti (51.5%, a difference of 0.39%).
| Demographics | Rating | Rank | College, 1 year or more |
| Immigrants | Portugal | 0.0 /100 | #307 | Tragic 51.9% |
| Salvadorans | 0.0 /100 | #308 | Tragic 51.8% |
| Apache | 0.0 /100 | #309 | Tragic 51.8% |
| Hondurans | 0.0 /100 | #310 | Tragic 51.6% |
| Immigrants | Haiti | 0.0 /100 | #311 | Tragic 51.5% |
| Pueblo | 0.0 /100 | #312 | Tragic 51.5% |
| Immigrants | Caribbean | 0.0 /100 | #313 | Tragic 51.4% |
| Fijians | 0.0 /100 | #314 | Tragic 51.3% |
| Guatemalans | 0.0 /100 | #315 | Tragic 51.2% |
| Cajuns | 0.0 /100 | #316 | Tragic 51.2% |
| Hispanics or Latinos | 0.0 /100 | #317 | Tragic 51.1% |
| Immigrants | Honduras | 0.0 /100 | #318 | Tragic 51.0% |
| Immigrants | El Salvador | 0.0 /100 | #319 | Tragic 51.0% |
| Kiowa | 0.0 /100 | #320 | Tragic 51.0% |
| Hopi | 0.0 /100 | #321 | Tragic 50.9% |
Demographics Similar to Syrians by College, 1 year or more
In terms of college, 1 year or more, the demographic groups most similar to Syrians are Immigrants from Northern Africa (61.9%, a difference of 0.0%), Immigrants from Ukraine (61.9%, a difference of 0.020%), European (61.8%, a difference of 0.020%), Macedonian (61.8%, a difference of 0.020%), and Austrian (61.8%, a difference of 0.080%).
| Demographics | Rating | Rank | College, 1 year or more |
| Swedes | 96.8 /100 | #101 | Exceptional 62.1% |
| Luxembourgers | 96.7 /100 | #102 | Exceptional 62.1% |
| Afghans | 96.4 /100 | #103 | Exceptional 62.0% |
| Chileans | 96.4 /100 | #104 | Exceptional 62.0% |
| Immigrants | Nepal | 96.3 /100 | #105 | Exceptional 62.0% |
| Palestinians | 96.3 /100 | #106 | Exceptional 62.0% |
| Immigrants | Ukraine | 95.8 /100 | #107 | Exceptional 61.9% |
| Syrians | 95.7 /100 | #108 | Exceptional 61.9% |
| Immigrants | Northern Africa | 95.7 /100 | #109 | Exceptional 61.9% |
| Europeans | 95.6 /100 | #110 | Exceptional 61.8% |
| Macedonians | 95.6 /100 | #111 | Exceptional 61.8% |
| Austrians | 95.4 /100 | #112 | Exceptional 61.8% |
| Ukrainians | 95.2 /100 | #113 | Exceptional 61.8% |
| Danes | 94.8 /100 | #114 | Exceptional 61.7% |
| Norwegians | 94.5 /100 | #115 | Exceptional 61.7% |