Guamanian/Chamorro vs Immigrants from Sierra Leone 11th Grade
COMPARE
Guamanian/Chamorro
Immigrants from Sierra Leone
11th Grade
11th Grade Comparison
Guamanians/Chamorros
Immigrants from Sierra Leone
92.5%
11TH GRADE
45.0/ 100
METRIC RATING
177th/ 347
METRIC RANK
92.0%
11TH GRADE
11.1/ 100
METRIC RATING
217th/ 347
METRIC RANK
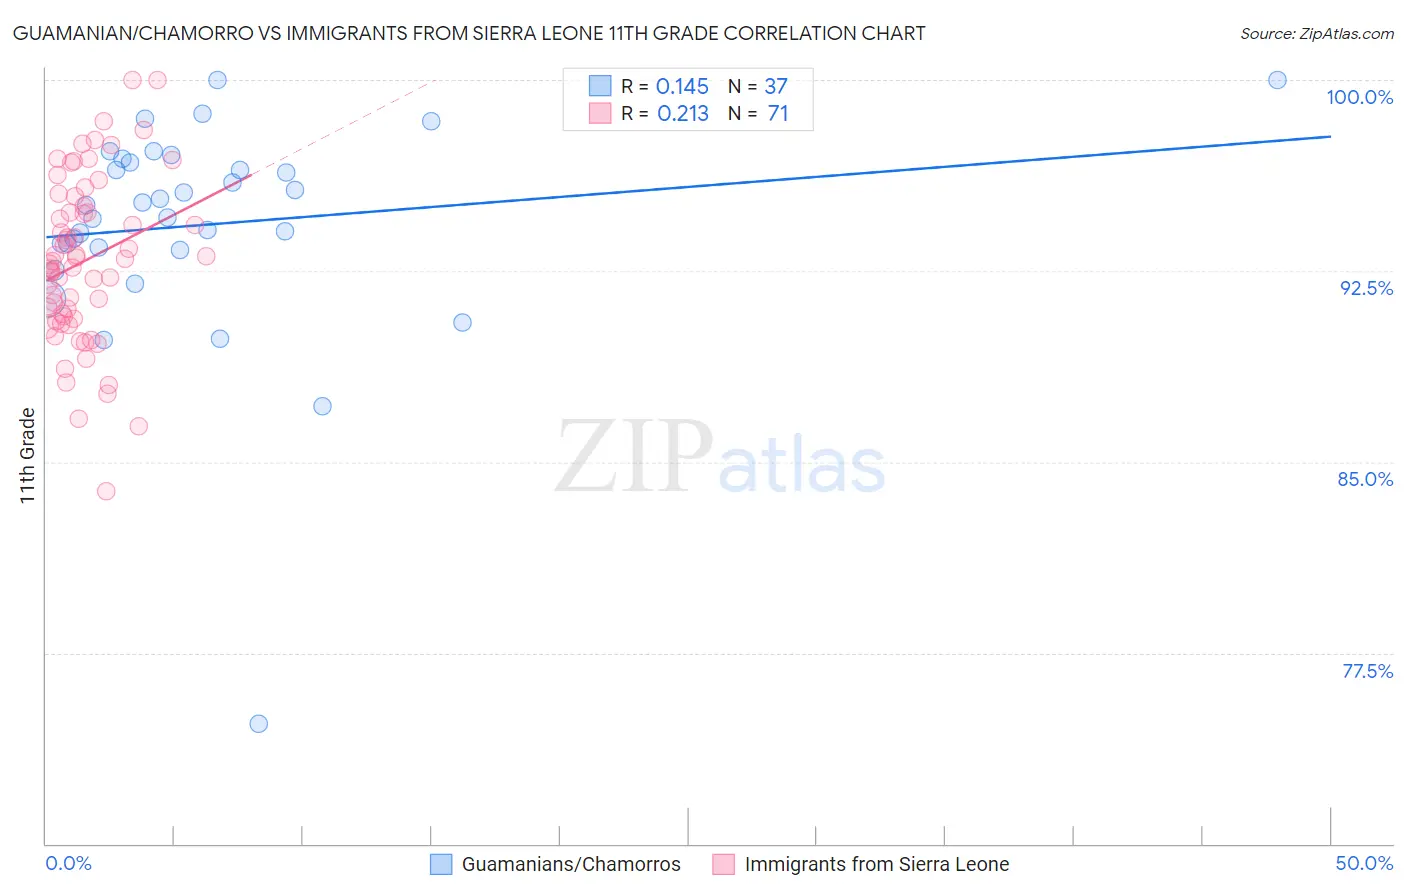
Guamanian/Chamorro vs Immigrants from Sierra Leone 11th Grade Correlation Chart
The statistical analysis conducted on geographies consisting of 221,965,618 people shows a poor positive correlation between the proportion of Guamanians/Chamorros and percentage of population with at least 11th grade education in the United States with a correlation coefficient (R) of 0.145 and weighted average of 92.5%. Similarly, the statistical analysis conducted on geographies consisting of 101,654,421 people shows a weak positive correlation between the proportion of Immigrants from Sierra Leone and percentage of population with at least 11th grade education in the United States with a correlation coefficient (R) of 0.213 and weighted average of 92.0%, a difference of 0.46%.
11th Grade Correlation Summary
| Measurement | Guamanian/Chamorro | Immigrants from Sierra Leone |
| Minimum | 74.7% | 83.9% |
| Maximum | 100.0% | 100.0% |
| Range | 25.3% | 16.1% |
| Mean | 94.3% | 92.9% |
| Median | 95.1% | 92.9% |
| Interquartile 25% (IQ1) | 93.4% | 90.6% |
| Interquartile 75% (IQ3) | 96.8% | 95.0% |
| Interquartile Range (IQR) | 3.5% | 4.4% |
| Standard Deviation (Sample) | 4.4% | 3.3% |
| Standard Deviation (Population) | 4.3% | 3.2% |
Similar Demographics by 11th Grade
Demographics Similar to Guamanians/Chamorros by 11th Grade
In terms of 11th grade, the demographic groups most similar to Guamanians/Chamorros are Spaniard (92.5%, a difference of 0.020%), Sudanese (92.5%, a difference of 0.020%), Shoshone (92.5%, a difference of 0.040%), Creek (92.4%, a difference of 0.040%), and Inupiat (92.4%, a difference of 0.040%).
| Demographics | Rating | Rank | 11th Grade |
| Immigrants | Northern Africa | 57.3 /100 | #170 | Average 92.6% |
| Laotians | 54.4 /100 | #171 | Average 92.6% |
| Immigrants | Pakistan | 52.3 /100 | #172 | Average 92.5% |
| Indians (Asian) | 51.5 /100 | #173 | Average 92.5% |
| Asians | 50.0 /100 | #174 | Average 92.5% |
| Shoshone | 48.9 /100 | #175 | Average 92.5% |
| Spaniards | 46.9 /100 | #176 | Average 92.5% |
| Guamanians/Chamorros | 45.0 /100 | #177 | Average 92.5% |
| Sudanese | 43.4 /100 | #178 | Average 92.5% |
| Creek | 40.9 /100 | #179 | Average 92.4% |
| Inupiat | 40.7 /100 | #180 | Average 92.4% |
| Cherokee | 40.7 /100 | #181 | Average 92.4% |
| Immigrants | Morocco | 38.6 /100 | #182 | Fair 92.4% |
| Immigrants | Malaysia | 37.6 /100 | #183 | Fair 92.4% |
| Immigrants | Asia | 37.4 /100 | #184 | Fair 92.4% |
Demographics Similar to Immigrants from Sierra Leone by 11th Grade
In terms of 11th grade, the demographic groups most similar to Immigrants from Sierra Leone are Somali (92.1%, a difference of 0.010%), Immigrants from Southern Europe (92.1%, a difference of 0.030%), Blackfeet (92.0%, a difference of 0.030%), Portuguese (92.0%, a difference of 0.030%), and Afghan (92.1%, a difference of 0.040%).
| Demographics | Rating | Rank | 11th Grade |
| Ethiopians | 18.8 /100 | #210 | Poor 92.2% |
| Immigrants | Micronesia | 17.7 /100 | #211 | Poor 92.2% |
| Koreans | 14.4 /100 | #212 | Poor 92.1% |
| Immigrants | Ethiopia | 13.9 /100 | #213 | Poor 92.1% |
| Afghans | 12.8 /100 | #214 | Poor 92.1% |
| Immigrants | Southern Europe | 12.5 /100 | #215 | Poor 92.1% |
| Somalis | 11.6 /100 | #216 | Poor 92.1% |
| Immigrants | Sierra Leone | 11.1 /100 | #217 | Poor 92.0% |
| Blackfeet | 10.1 /100 | #218 | Poor 92.0% |
| Portuguese | 10.0 /100 | #219 | Tragic 92.0% |
| South American Indians | 7.6 /100 | #220 | Tragic 92.0% |
| Immigrants | Liberia | 7.0 /100 | #221 | Tragic 91.9% |
| Immigrants | Africa | 6.5 /100 | #222 | Tragic 91.9% |
| Immigrants | Bahamas | 6.5 /100 | #223 | Tragic 91.9% |
| Costa Ricans | 6.3 /100 | #224 | Tragic 91.9% |