Menominee vs Immigrants from Laos 11th Grade
COMPARE
Menominee
Immigrants from Laos
11th Grade
11th Grade Comparison
Menominee
Immigrants from Laos
93.5%
11TH GRADE
98.7/ 100
METRIC RATING
99th/ 347
METRIC RANK
90.5%
11TH GRADE
0.0/ 100
METRIC RATING
284th/ 347
METRIC RANK
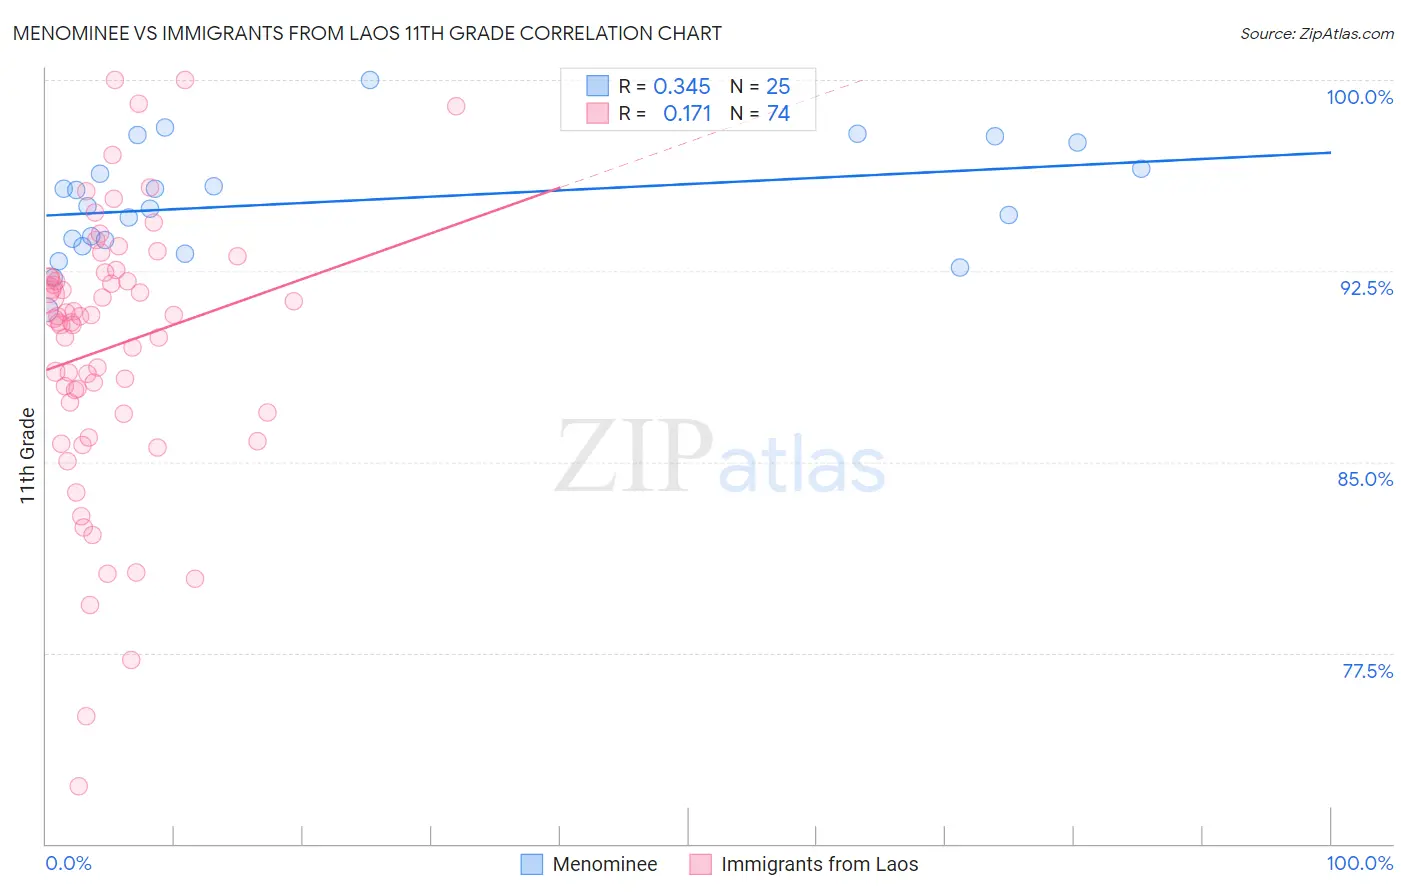
Menominee vs Immigrants from Laos 11th Grade Correlation Chart
The statistical analysis conducted on geographies consisting of 45,778,829 people shows a mild positive correlation between the proportion of Menominee and percentage of population with at least 11th grade education in the United States with a correlation coefficient (R) of 0.345 and weighted average of 93.5%. Similarly, the statistical analysis conducted on geographies consisting of 201,472,886 people shows a poor positive correlation between the proportion of Immigrants from Laos and percentage of population with at least 11th grade education in the United States with a correlation coefficient (R) of 0.171 and weighted average of 90.5%, a difference of 3.3%.
11th Grade Correlation Summary
| Measurement | Menominee | Immigrants from Laos |
| Minimum | 91.0% | 72.3% |
| Maximum | 100.0% | 100.0% |
| Range | 9.0% | 27.7% |
| Mean | 95.2% | 89.5% |
| Median | 95.0% | 90.7% |
| Interquartile 25% (IQ1) | 93.6% | 86.9% |
| Interquartile 75% (IQ3) | 97.0% | 92.3% |
| Interquartile Range (IQR) | 3.4% | 5.3% |
| Standard Deviation (Sample) | 2.2% | 5.4% |
| Standard Deviation (Population) | 2.1% | 5.4% |
Similar Demographics by 11th Grade
Demographics Similar to Menominee by 11th Grade
In terms of 11th grade, the demographic groups most similar to Menominee are Immigrants from Israel (93.5%, a difference of 0.0%), Immigrants from North Macedonia (93.5%, a difference of 0.010%), Immigrants from Iran (93.5%, a difference of 0.020%), Immigrants from Romania (93.5%, a difference of 0.020%), and Immigrants from Turkey (93.5%, a difference of 0.030%).
| Demographics | Rating | Rank | 11th Grade |
| Immigrants | Bulgaria | 99.1 /100 | #92 | Exceptional 93.6% |
| Puget Sound Salish | 99.1 /100 | #93 | Exceptional 93.6% |
| Swiss | 99.0 /100 | #94 | Exceptional 93.6% |
| Immigrants | France | 99.0 /100 | #95 | Exceptional 93.6% |
| Immigrants | Turkey | 98.9 /100 | #96 | Exceptional 93.5% |
| Immigrants | Iran | 98.9 /100 | #97 | Exceptional 93.5% |
| Immigrants | Israel | 98.8 /100 | #98 | Exceptional 93.5% |
| Menominee | 98.7 /100 | #99 | Exceptional 93.5% |
| Immigrants | North Macedonia | 98.7 /100 | #100 | Exceptional 93.5% |
| Immigrants | Romania | 98.7 /100 | #101 | Exceptional 93.5% |
| Chippewa | 98.6 /100 | #102 | Exceptional 93.5% |
| Lebanese | 98.6 /100 | #103 | Exceptional 93.5% |
| Immigrants | Europe | 98.6 /100 | #104 | Exceptional 93.5% |
| Immigrants | Serbia | 98.6 /100 | #105 | Exceptional 93.5% |
| Immigrants | Croatia | 98.6 /100 | #106 | Exceptional 93.5% |
Demographics Similar to Immigrants from Laos by 11th Grade
In terms of 11th grade, the demographic groups most similar to Immigrants from Laos are Immigrants from Burma/Myanmar (90.4%, a difference of 0.090%), Immigrants from West Indies (90.4%, a difference of 0.14%), Apache (90.4%, a difference of 0.15%), Immigrants from Barbados (90.7%, a difference of 0.17%), and Pennsylvania German (90.3%, a difference of 0.17%).
| Demographics | Rating | Rank | 11th Grade |
| Immigrants | Congo | 0.1 /100 | #277 | Tragic 90.9% |
| Malaysians | 0.1 /100 | #278 | Tragic 90.8% |
| Barbadians | 0.0 /100 | #279 | Tragic 90.8% |
| Sri Lankans | 0.0 /100 | #280 | Tragic 90.7% |
| Dutch West Indians | 0.0 /100 | #281 | Tragic 90.7% |
| Immigrants | St. Vincent and the Grenadines | 0.0 /100 | #282 | Tragic 90.7% |
| Immigrants | Barbados | 0.0 /100 | #283 | Tragic 90.7% |
| Immigrants | Laos | 0.0 /100 | #284 | Tragic 90.5% |
| Immigrants | Burma/Myanmar | 0.0 /100 | #285 | Tragic 90.4% |
| Immigrants | West Indies | 0.0 /100 | #286 | Tragic 90.4% |
| Apache | 0.0 /100 | #287 | Tragic 90.4% |
| Pennsylvania Germans | 0.0 /100 | #288 | Tragic 90.3% |
| British West Indians | 0.0 /100 | #289 | Tragic 90.3% |
| Indonesians | 0.0 /100 | #290 | Tragic 90.3% |
| Haitians | 0.0 /100 | #291 | Tragic 90.3% |