Mexican American Indian vs African 11th Grade
COMPARE
Mexican American Indian
African
11th Grade
11th Grade Comparison
Mexican American Indians
Africans
87.5%
11TH GRADE
0.0/ 100
METRIC RATING
329th/ 347
METRIC RANK
91.5%
11TH GRADE
1.3/ 100
METRIC RATING
245th/ 347
METRIC RANK
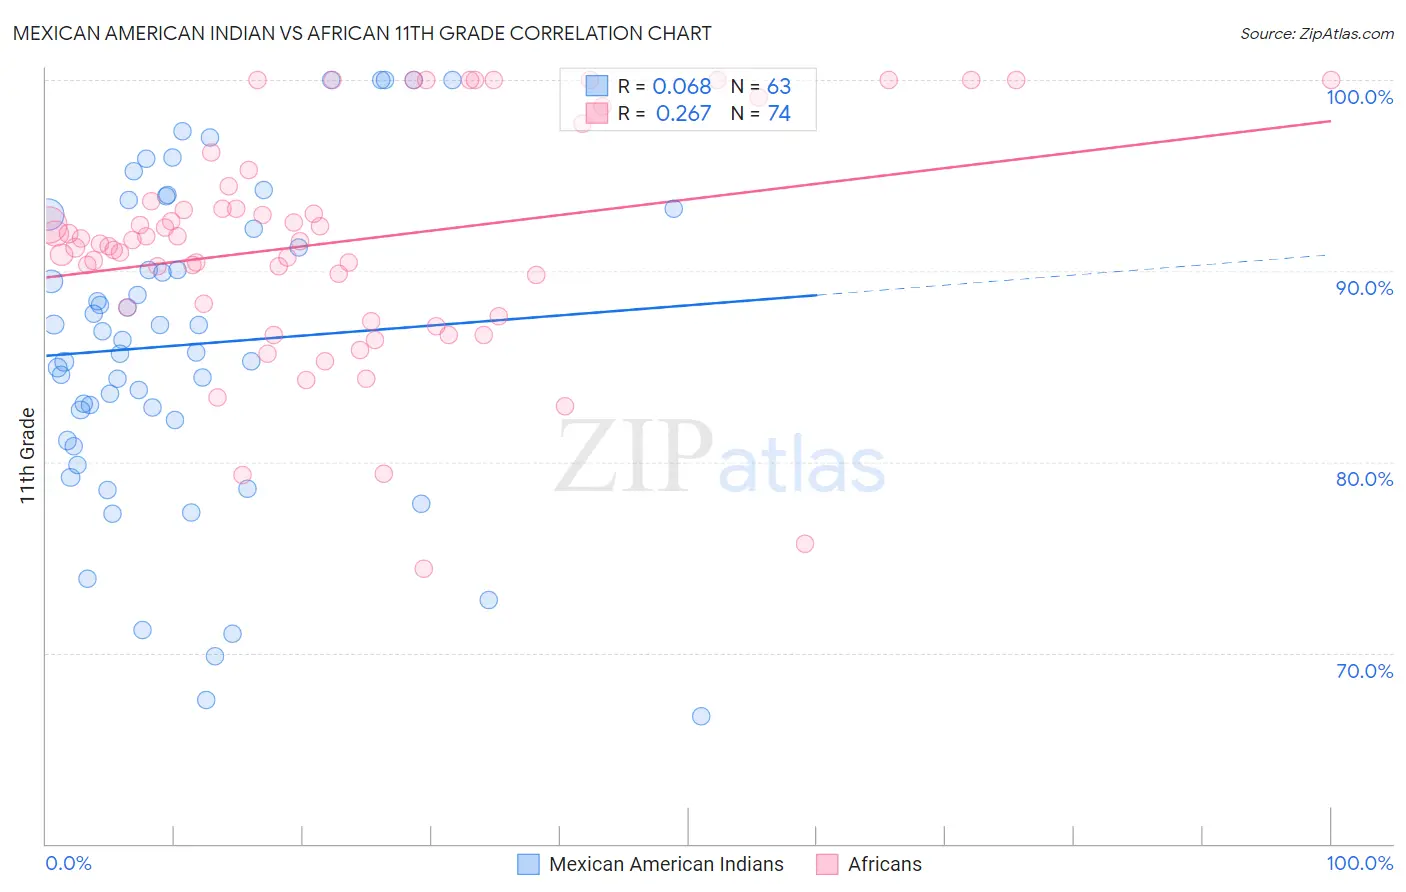
Mexican American Indian vs African 11th Grade Correlation Chart
The statistical analysis conducted on geographies consisting of 317,621,155 people shows a slight positive correlation between the proportion of Mexican American Indians and percentage of population with at least 11th grade education in the United States with a correlation coefficient (R) of 0.068 and weighted average of 87.5%. Similarly, the statistical analysis conducted on geographies consisting of 470,094,658 people shows a weak positive correlation between the proportion of Africans and percentage of population with at least 11th grade education in the United States with a correlation coefficient (R) of 0.267 and weighted average of 91.5%, a difference of 4.6%.
11th Grade Correlation Summary
| Measurement | Mexican American Indian | African |
| Minimum | 66.7% | 74.4% |
| Maximum | 100.0% | 100.0% |
| Range | 33.3% | 25.6% |
| Mean | 86.1% | 91.5% |
| Median | 86.4% | 91.6% |
| Interquartile 25% (IQ1) | 81.1% | 88.1% |
| Interquartile 75% (IQ3) | 93.0% | 94.4% |
| Interquartile Range (IQR) | 11.8% | 6.3% |
| Standard Deviation (Sample) | 8.3% | 5.9% |
| Standard Deviation (Population) | 8.3% | 5.8% |
Similar Demographics by 11th Grade
Demographics Similar to Mexican American Indians by 11th Grade
In terms of 11th grade, the demographic groups most similar to Mexican American Indians are Tohono O'odham (87.6%, a difference of 0.070%), Immigrants from Cabo Verde (87.6%, a difference of 0.13%), Dominican (87.7%, a difference of 0.15%), Honduran (87.4%, a difference of 0.19%), and Hispanic or Latino (87.3%, a difference of 0.25%).
| Demographics | Rating | Rank | 11th Grade |
| Puerto Ricans | 0.0 /100 | #322 | Tragic 88.4% |
| Pima | 0.0 /100 | #323 | Tragic 88.3% |
| Central American Indians | 0.0 /100 | #324 | Tragic 88.2% |
| Immigrants | Nicaragua | 0.0 /100 | #325 | Tragic 88.1% |
| Dominicans | 0.0 /100 | #326 | Tragic 87.7% |
| Immigrants | Cabo Verde | 0.0 /100 | #327 | Tragic 87.6% |
| Tohono O'odham | 0.0 /100 | #328 | Tragic 87.6% |
| Mexican American Indians | 0.0 /100 | #329 | Tragic 87.5% |
| Hondurans | 0.0 /100 | #330 | Tragic 87.4% |
| Hispanics or Latinos | 0.0 /100 | #331 | Tragic 87.3% |
| Immigrants | Azores | 0.0 /100 | #332 | Tragic 87.2% |
| Immigrants | Yemen | 0.0 /100 | #333 | Tragic 87.1% |
| Houma | 0.0 /100 | #334 | Tragic 87.0% |
| Central Americans | 0.0 /100 | #335 | Tragic 86.9% |
| Immigrants | Dominican Republic | 0.0 /100 | #336 | Tragic 86.9% |
Demographics Similar to Africans by 11th Grade
In terms of 11th grade, the demographic groups most similar to Africans are Senegalese (91.6%, a difference of 0.010%), Immigrants from Thailand (91.6%, a difference of 0.020%), Seminole (91.5%, a difference of 0.030%), Immigrants from Middle Africa (91.6%, a difference of 0.050%), and Immigrants from Philippines (91.5%, a difference of 0.070%).
| Demographics | Rating | Rank | 11th Grade |
| Comanche | 2.6 /100 | #238 | Tragic 91.7% |
| Hopi | 2.5 /100 | #239 | Tragic 91.7% |
| South Americans | 2.0 /100 | #240 | Tragic 91.6% |
| Bahamians | 1.8 /100 | #241 | Tragic 91.6% |
| Immigrants | Middle Africa | 1.6 /100 | #242 | Tragic 91.6% |
| Immigrants | Thailand | 1.4 /100 | #243 | Tragic 91.6% |
| Senegalese | 1.4 /100 | #244 | Tragic 91.6% |
| Africans | 1.3 /100 | #245 | Tragic 91.5% |
| Seminole | 1.2 /100 | #246 | Tragic 91.5% |
| Immigrants | Philippines | 1.0 /100 | #247 | Tragic 91.5% |
| Immigrants | Uzbekistan | 1.0 /100 | #248 | Tragic 91.5% |
| Peruvians | 1.0 /100 | #249 | Tragic 91.5% |
| Ghanaians | 0.9 /100 | #250 | Tragic 91.5% |
| Immigrants | Costa Rica | 0.9 /100 | #251 | Tragic 91.4% |
| Immigrants | Nigeria | 0.8 /100 | #252 | Tragic 91.4% |