Australian vs Jamaican Nursery School
COMPARE
Australian
Jamaican
Nursery School
Nursery School Comparison
Australians
Jamaicans
98.5%
NURSERY SCHOOL
99.8/ 100
METRIC RATING
52nd/ 347
METRIC RANK
97.6%
NURSERY SCHOOL
0.6/ 100
METRIC RATING
258th/ 347
METRIC RANK
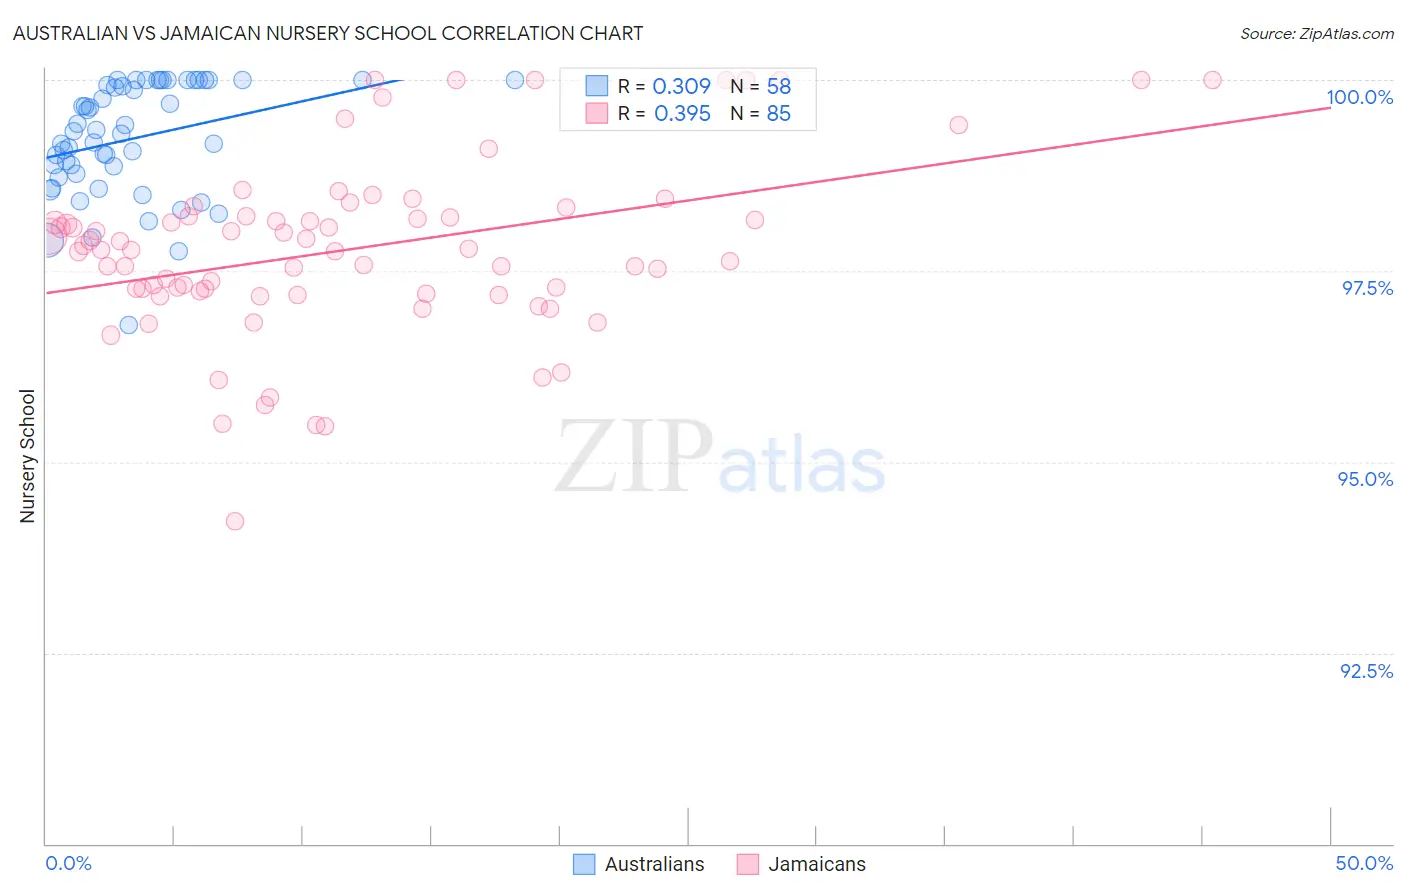
Australian vs Jamaican Nursery School Correlation Chart
The statistical analysis conducted on geographies consisting of 224,153,392 people shows a mild positive correlation between the proportion of Australians and percentage of population with at least nursery school education in the United States with a correlation coefficient (R) of 0.309 and weighted average of 98.5%. Similarly, the statistical analysis conducted on geographies consisting of 368,084,732 people shows a mild positive correlation between the proportion of Jamaicans and percentage of population with at least nursery school education in the United States with a correlation coefficient (R) of 0.395 and weighted average of 97.6%, a difference of 0.87%.
Nursery School Correlation Summary
| Measurement | Australian | Jamaican |
| Minimum | 96.8% | 94.2% |
| Maximum | 100.0% | 100.0% |
| Range | 3.2% | 5.8% |
| Mean | 99.2% | 97.8% |
| Median | 99.3% | 97.8% |
| Interquartile 25% (IQ1) | 98.8% | 97.2% |
| Interquartile 75% (IQ3) | 100.0% | 98.2% |
| Interquartile Range (IQR) | 1.2% | 1.0% |
| Standard Deviation (Sample) | 0.74% | 1.2% |
| Standard Deviation (Population) | 0.73% | 1.1% |
Similar Demographics by Nursery School
Demographics Similar to Australians by Nursery School
In terms of nursery school, the demographic groups most similar to Australians are White/Caucasian (98.5%, a difference of 0.0%), Celtic (98.5%, a difference of 0.0%), Estonian (98.5%, a difference of 0.0%), Czechoslovakian (98.5%, a difference of 0.010%), and Ottawa (98.5%, a difference of 0.010%).
| Demographics | Rating | Rank | Nursery School |
| Northern Europeans | 99.9 /100 | #45 | Exceptional 98.5% |
| Hungarians | 99.9 /100 | #46 | Exceptional 98.5% |
| Czechoslovakians | 99.9 /100 | #47 | Exceptional 98.5% |
| Ottawa | 99.8 /100 | #48 | Exceptional 98.5% |
| Whites/Caucasians | 99.8 /100 | #49 | Exceptional 98.5% |
| Celtics | 99.8 /100 | #50 | Exceptional 98.5% |
| Estonians | 99.8 /100 | #51 | Exceptional 98.5% |
| Australians | 99.8 /100 | #52 | Exceptional 98.5% |
| Kiowa | 99.8 /100 | #53 | Exceptional 98.4% |
| Pueblo | 99.8 /100 | #54 | Exceptional 98.4% |
| Immigrants | Scotland | 99.8 /100 | #55 | Exceptional 98.4% |
| Americans | 99.8 /100 | #56 | Exceptional 98.4% |
| Austrians | 99.8 /100 | #57 | Exceptional 98.4% |
| Bulgarians | 99.8 /100 | #58 | Exceptional 98.4% |
| Immigrants | Canada | 99.8 /100 | #59 | Exceptional 98.4% |
Demographics Similar to Jamaicans by Nursery School
In terms of nursery school, the demographic groups most similar to Jamaicans are Immigrants from Colombia (97.6%, a difference of 0.0%), Immigrants from Congo (97.6%, a difference of 0.010%), Immigrants from Asia (97.6%, a difference of 0.010%), Yaqui (97.6%, a difference of 0.010%), and Ethiopian (97.6%, a difference of 0.020%).
| Demographics | Rating | Rank | Nursery School |
| Ethiopians | 0.8 /100 | #251 | Tragic 97.6% |
| Immigrants | Africa | 0.8 /100 | #252 | Tragic 97.6% |
| Immigrants | Iraq | 0.7 /100 | #253 | Tragic 97.6% |
| Immigrants | Congo | 0.7 /100 | #254 | Tragic 97.6% |
| Immigrants | Asia | 0.7 /100 | #255 | Tragic 97.6% |
| Yaqui | 0.6 /100 | #256 | Tragic 97.6% |
| Immigrants | Colombia | 0.6 /100 | #257 | Tragic 97.6% |
| Jamaicans | 0.6 /100 | #258 | Tragic 97.6% |
| Armenians | 0.4 /100 | #259 | Tragic 97.6% |
| Immigrants | South America | 0.4 /100 | #260 | Tragic 97.6% |
| Cubans | 0.4 /100 | #261 | Tragic 97.6% |
| Immigrants | Ethiopia | 0.4 /100 | #262 | Tragic 97.6% |
| Fijians | 0.3 /100 | #263 | Tragic 97.6% |
| Taiwanese | 0.3 /100 | #264 | Tragic 97.6% |
| Assyrians/Chaldeans/Syriacs | 0.3 /100 | #265 | Tragic 97.6% |