Australian vs Immigrants from Fiji Nursery School
COMPARE
Australian
Immigrants from Fiji
Nursery School
Nursery School Comparison
Australians
Immigrants from Fiji
98.5%
NURSERY SCHOOL
99.8/ 100
METRIC RATING
52nd/ 347
METRIC RANK
96.5%
NURSERY SCHOOL
0.0/ 100
METRIC RATING
338th/ 347
METRIC RANK
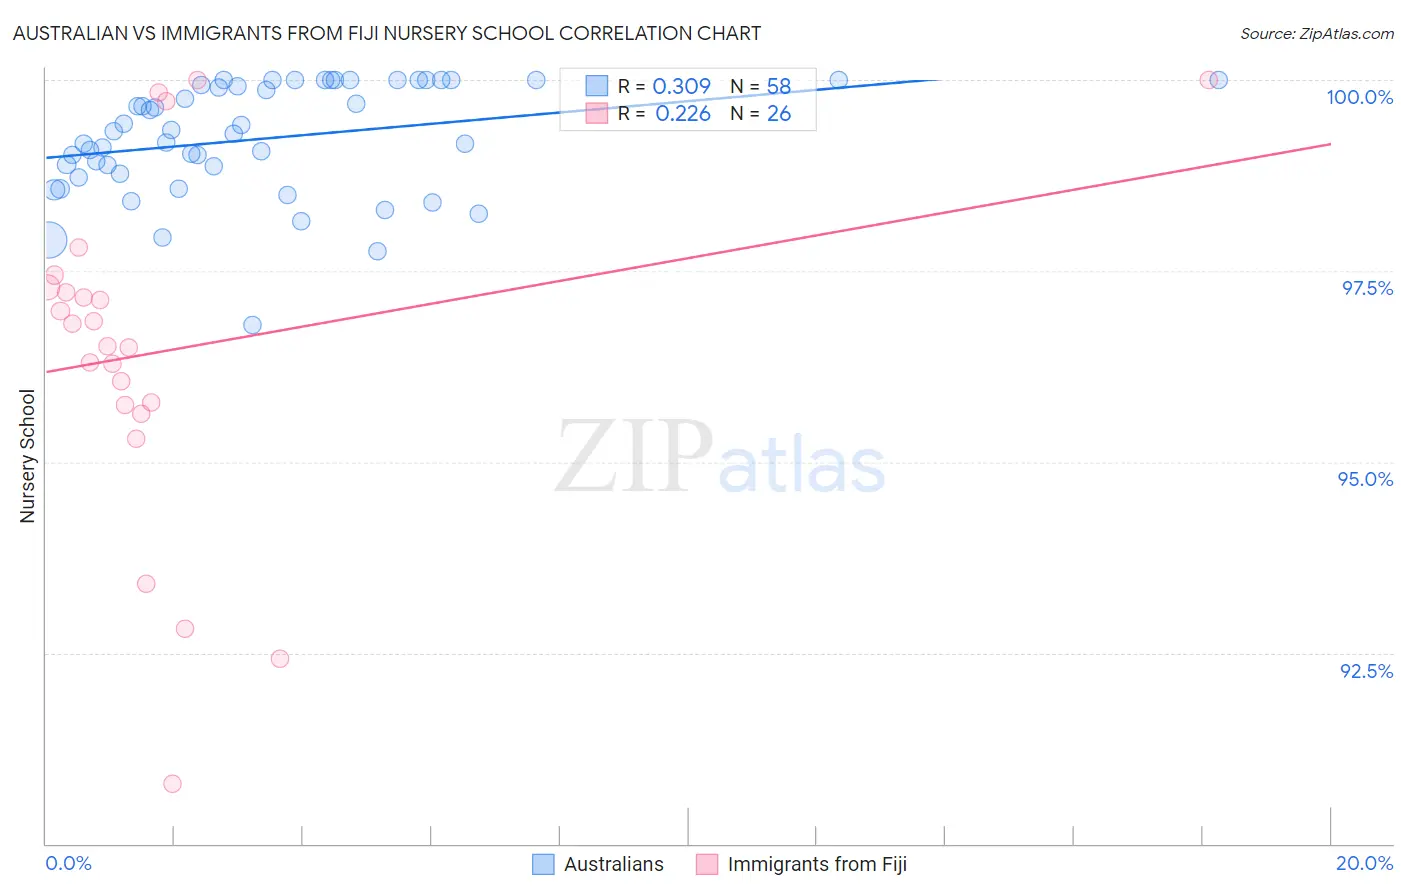
Australian vs Immigrants from Fiji Nursery School Correlation Chart
The statistical analysis conducted on geographies consisting of 224,153,392 people shows a mild positive correlation between the proportion of Australians and percentage of population with at least nursery school education in the United States with a correlation coefficient (R) of 0.309 and weighted average of 98.5%. Similarly, the statistical analysis conducted on geographies consisting of 93,756,204 people shows a weak positive correlation between the proportion of Immigrants from Fiji and percentage of population with at least nursery school education in the United States with a correlation coefficient (R) of 0.226 and weighted average of 96.5%, a difference of 2.0%.
Nursery School Correlation Summary
| Measurement | Australian | Immigrants from Fiji |
| Minimum | 96.8% | 90.8% |
| Maximum | 100.0% | 100.0% |
| Range | 3.2% | 9.2% |
| Mean | 99.2% | 96.5% |
| Median | 99.3% | 96.7% |
| Interquartile 25% (IQ1) | 98.8% | 95.7% |
| Interquartile 75% (IQ3) | 100.0% | 97.3% |
| Interquartile Range (IQR) | 1.2% | 1.5% |
| Standard Deviation (Sample) | 0.74% | 2.3% |
| Standard Deviation (Population) | 0.73% | 2.2% |
Similar Demographics by Nursery School
Demographics Similar to Australians by Nursery School
In terms of nursery school, the demographic groups most similar to Australians are White/Caucasian (98.5%, a difference of 0.0%), Celtic (98.5%, a difference of 0.0%), Estonian (98.5%, a difference of 0.0%), Czechoslovakian (98.5%, a difference of 0.010%), and Ottawa (98.5%, a difference of 0.010%).
| Demographics | Rating | Rank | Nursery School |
| Northern Europeans | 99.9 /100 | #45 | Exceptional 98.5% |
| Hungarians | 99.9 /100 | #46 | Exceptional 98.5% |
| Czechoslovakians | 99.9 /100 | #47 | Exceptional 98.5% |
| Ottawa | 99.8 /100 | #48 | Exceptional 98.5% |
| Whites/Caucasians | 99.8 /100 | #49 | Exceptional 98.5% |
| Celtics | 99.8 /100 | #50 | Exceptional 98.5% |
| Estonians | 99.8 /100 | #51 | Exceptional 98.5% |
| Australians | 99.8 /100 | #52 | Exceptional 98.5% |
| Kiowa | 99.8 /100 | #53 | Exceptional 98.4% |
| Pueblo | 99.8 /100 | #54 | Exceptional 98.4% |
| Immigrants | Scotland | 99.8 /100 | #55 | Exceptional 98.4% |
| Americans | 99.8 /100 | #56 | Exceptional 98.4% |
| Austrians | 99.8 /100 | #57 | Exceptional 98.4% |
| Bulgarians | 99.8 /100 | #58 | Exceptional 98.4% |
| Immigrants | Canada | 99.8 /100 | #59 | Exceptional 98.4% |
Demographics Similar to Immigrants from Fiji by Nursery School
In terms of nursery school, the demographic groups most similar to Immigrants from Fiji are Immigrants from Cambodia (96.5%, a difference of 0.0%), Guatemalan (96.6%, a difference of 0.040%), Bangladeshi (96.6%, a difference of 0.070%), Immigrants from Guatemala (96.4%, a difference of 0.080%), and Immigrants from Dominican Republic (96.6%, a difference of 0.090%).
| Demographics | Rating | Rank | Nursery School |
| Immigrants | Armenia | 0.0 /100 | #331 | Tragic 96.7% |
| Yakama | 0.0 /100 | #332 | Tragic 96.6% |
| Central Americans | 0.0 /100 | #333 | Tragic 96.6% |
| Immigrants | Dominican Republic | 0.0 /100 | #334 | Tragic 96.6% |
| Bangladeshis | 0.0 /100 | #335 | Tragic 96.6% |
| Guatemalans | 0.0 /100 | #336 | Tragic 96.6% |
| Immigrants | Cambodia | 0.0 /100 | #337 | Tragic 96.5% |
| Immigrants | Fiji | 0.0 /100 | #338 | Tragic 96.5% |
| Immigrants | Guatemala | 0.0 /100 | #339 | Tragic 96.4% |
| Immigrants | Central America | 0.0 /100 | #340 | Tragic 96.4% |
| Immigrants | Cabo Verde | 0.0 /100 | #341 | Tragic 96.4% |
| Immigrants | Mexico | 0.0 /100 | #342 | Tragic 96.4% |
| Salvadorans | 0.0 /100 | #343 | Tragic 96.4% |
| Immigrants | El Salvador | 0.0 /100 | #344 | Tragic 96.2% |
| Nepalese | 0.0 /100 | #345 | Tragic 96.2% |