Australian vs Immigrants from Sierra Leone 8th Grade
COMPARE
Australian
Immigrants from Sierra Leone
8th Grade
8th Grade Comparison
Australians
Immigrants from Sierra Leone
96.7%
8TH GRADE
99.8/ 100
METRIC RATING
56th/ 347
METRIC RANK
95.1%
8TH GRADE
2.1/ 100
METRIC RATING
239th/ 347
METRIC RANK
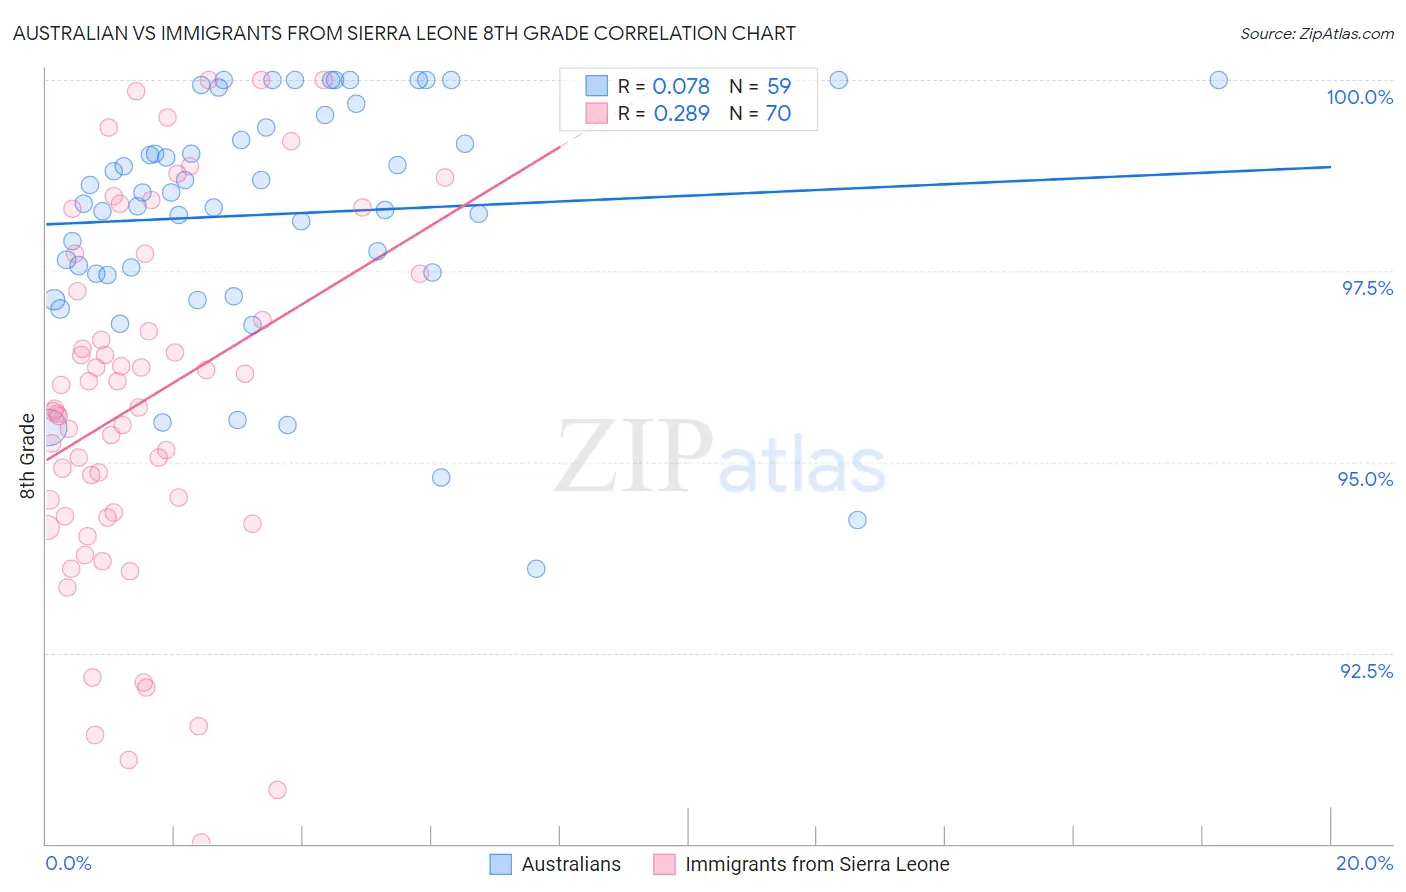
Australian vs Immigrants from Sierra Leone 8th Grade Correlation Chart
The statistical analysis conducted on geographies consisting of 224,153,693 people shows a slight positive correlation between the proportion of Australians and percentage of population with at least 8th grade education in the United States with a correlation coefficient (R) of 0.078 and weighted average of 96.7%. Similarly, the statistical analysis conducted on geographies consisting of 101,634,956 people shows a weak positive correlation between the proportion of Immigrants from Sierra Leone and percentage of population with at least 8th grade education in the United States with a correlation coefficient (R) of 0.289 and weighted average of 95.1%, a difference of 1.7%.
8th Grade Correlation Summary
| Measurement | Australian | Immigrants from Sierra Leone |
| Minimum | 93.6% | 90.0% |
| Maximum | 100.0% | 100.0% |
| Range | 6.4% | 10.0% |
| Mean | 98.2% | 95.8% |
| Median | 98.5% | 95.7% |
| Interquartile 25% (IQ1) | 97.5% | 94.3% |
| Interquartile 75% (IQ3) | 99.5% | 97.5% |
| Interquartile Range (IQR) | 2.1% | 3.2% |
| Standard Deviation (Sample) | 1.6% | 2.4% |
| Standard Deviation (Population) | 1.6% | 2.4% |
Similar Demographics by 8th Grade
Demographics Similar to Australians by 8th Grade
In terms of 8th grade, the demographic groups most similar to Australians are Serbian (96.7%, a difference of 0.0%), Russian (96.7%, a difference of 0.0%), Macedonian (96.7%, a difference of 0.0%), Austrian (96.7%, a difference of 0.010%), and Greek (96.8%, a difference of 0.030%).
| Demographics | Rating | Rank | 8th Grade |
| Estonians | 99.9 /100 | #49 | Exceptional 96.8% |
| Immigrants | Scotland | 99.9 /100 | #50 | Exceptional 96.8% |
| Celtics | 99.9 /100 | #51 | Exceptional 96.8% |
| Greeks | 99.9 /100 | #52 | Exceptional 96.8% |
| Austrians | 99.9 /100 | #53 | Exceptional 96.7% |
| Serbians | 99.8 /100 | #54 | Exceptional 96.7% |
| Russians | 99.8 /100 | #55 | Exceptional 96.7% |
| Australians | 99.8 /100 | #56 | Exceptional 96.7% |
| Macedonians | 99.8 /100 | #57 | Exceptional 96.7% |
| Immigrants | Canada | 99.8 /100 | #58 | Exceptional 96.7% |
| Immigrants | North America | 99.8 /100 | #59 | Exceptional 96.7% |
| Immigrants | Northern Europe | 99.8 /100 | #60 | Exceptional 96.7% |
| Immigrants | Austria | 99.8 /100 | #61 | Exceptional 96.7% |
| Whites/Caucasians | 99.8 /100 | #62 | Exceptional 96.7% |
| Ukrainians | 99.7 /100 | #63 | Exceptional 96.7% |
Demographics Similar to Immigrants from Sierra Leone by 8th Grade
In terms of 8th grade, the demographic groups most similar to Immigrants from Sierra Leone are Ethiopian (95.1%, a difference of 0.0%), South American Indian (95.1%, a difference of 0.010%), Native/Alaskan (95.2%, a difference of 0.020%), Tongan (95.1%, a difference of 0.030%), and Paiute (95.1%, a difference of 0.030%).
| Demographics | Rating | Rank | 8th Grade |
| Indians (Asian) | 3.3 /100 | #232 | Tragic 95.2% |
| Immigrants | Asia | 3.1 /100 | #233 | Tragic 95.2% |
| Costa Ricans | 3.0 /100 | #234 | Tragic 95.2% |
| Nigerians | 2.9 /100 | #235 | Tragic 95.2% |
| Senegalese | 2.7 /100 | #236 | Tragic 95.2% |
| Immigrants | Africa | 2.7 /100 | #237 | Tragic 95.2% |
| Natives/Alaskans | 2.3 /100 | #238 | Tragic 95.2% |
| Immigrants | Sierra Leone | 2.1 /100 | #239 | Tragic 95.1% |
| Ethiopians | 2.0 /100 | #240 | Tragic 95.1% |
| South American Indians | 1.9 /100 | #241 | Tragic 95.1% |
| Tongans | 1.7 /100 | #242 | Tragic 95.1% |
| Paiute | 1.7 /100 | #243 | Tragic 95.1% |
| Immigrants | Middle Africa | 1.7 /100 | #244 | Tragic 95.1% |
| Jamaicans | 1.4 /100 | #245 | Tragic 95.1% |
| Somalis | 1.4 /100 | #246 | Tragic 95.1% |