Australian vs Immigrants from Bangladesh Single Father Poverty
COMPARE
Australian
Immigrants from Bangladesh
Single Father Poverty
Single Father Poverty Comparison
Australians
Immigrants from Bangladesh
15.7%
SINGLE FATHER POVERTY
96.1/ 100
METRIC RATING
104th/ 347
METRIC RANK
16.3%
SINGLE FATHER POVERTY
55.1/ 100
METRIC RATING
165th/ 347
METRIC RANK
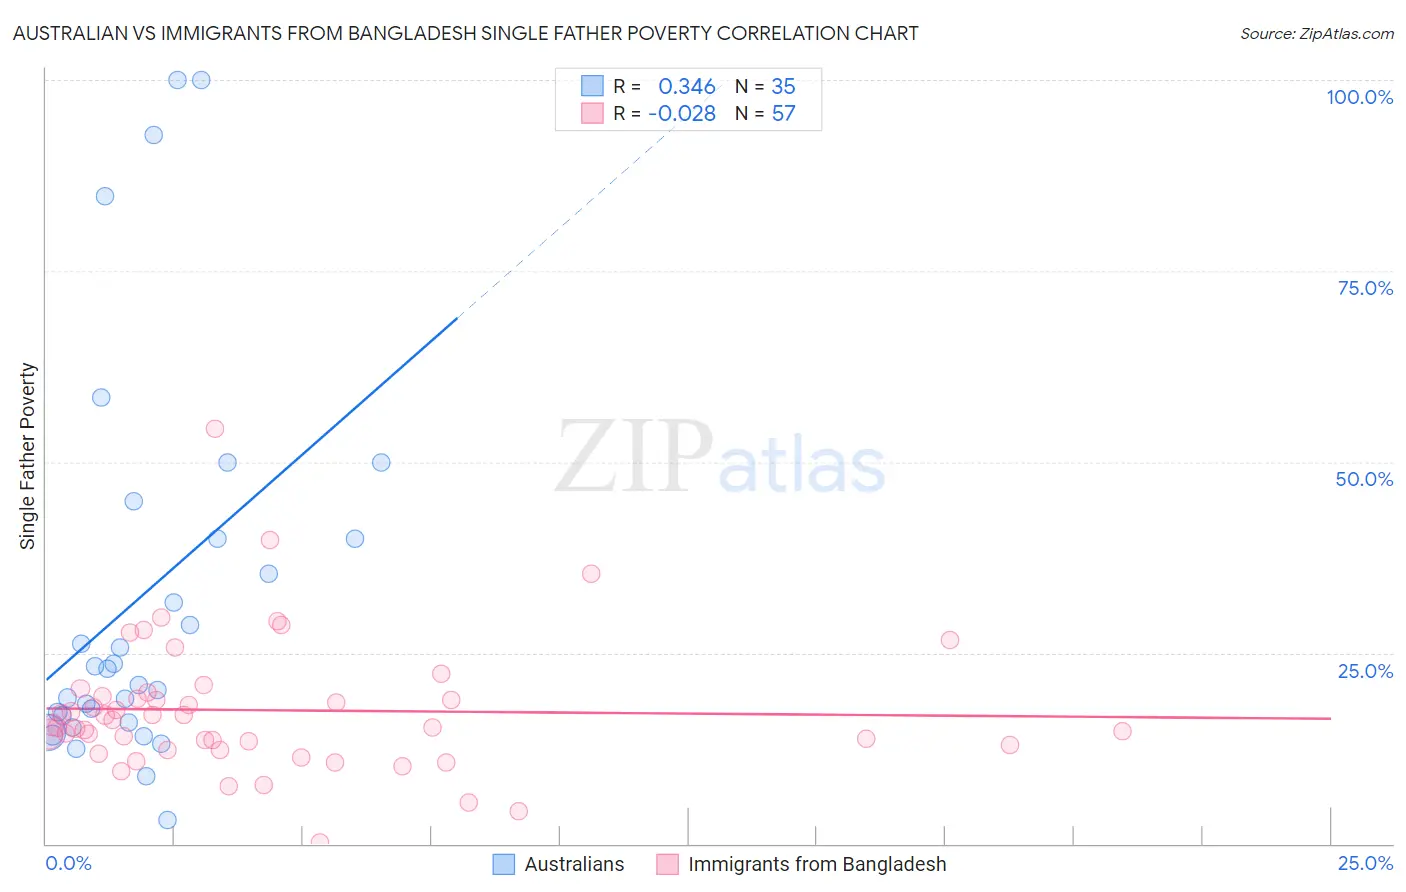
Australian vs Immigrants from Bangladesh Single Father Poverty Correlation Chart
The statistical analysis conducted on geographies consisting of 185,666,676 people shows a mild positive correlation between the proportion of Australians and poverty level among single fathers in the United States with a correlation coefficient (R) of 0.346 and weighted average of 15.7%. Similarly, the statistical analysis conducted on geographies consisting of 172,245,221 people shows no correlation between the proportion of Immigrants from Bangladesh and poverty level among single fathers in the United States with a correlation coefficient (R) of -0.028 and weighted average of 16.3%, a difference of 3.4%.
Single Father Poverty Correlation Summary
| Measurement | Australian | Immigrants from Bangladesh |
| Minimum | 3.1% | 0.23% |
| Maximum | 100.0% | 54.3% |
| Range | 96.9% | 54.0% |
| Mean | 32.5% | 17.5% |
| Median | 22.9% | 15.6% |
| Interquartile 25% (IQ1) | 15.8% | 12.6% |
| Interquartile 75% (IQ3) | 40.0% | 19.6% |
| Interquartile Range (IQR) | 24.2% | 6.9% |
| Standard Deviation (Sample) | 25.8% | 8.8% |
| Standard Deviation (Population) | 25.5% | 8.7% |
Similar Demographics by Single Father Poverty
Demographics Similar to Australians by Single Father Poverty
In terms of single father poverty, the demographic groups most similar to Australians are Immigrants from Australia (15.7%, a difference of 0.010%), South American Indian (15.7%, a difference of 0.020%), Chilean (15.7%, a difference of 0.080%), Immigrants from Poland (15.7%, a difference of 0.080%), and Native Hawaiian (15.7%, a difference of 0.10%).
| Demographics | Rating | Rank | Single Father Poverty |
| Yaqui | 98.1 /100 | #97 | Exceptional 15.6% |
| Zimbabweans | 98.1 /100 | #98 | Exceptional 15.6% |
| Immigrants | Middle Africa | 97.4 /100 | #99 | Exceptional 15.6% |
| Immigrants | Chile | 96.9 /100 | #100 | Exceptional 15.7% |
| Fijians | 96.8 /100 | #101 | Exceptional 15.7% |
| Chileans | 96.4 /100 | #102 | Exceptional 15.7% |
| South American Indians | 96.2 /100 | #103 | Exceptional 15.7% |
| Australians | 96.1 /100 | #104 | Exceptional 15.7% |
| Immigrants | Australia | 96.1 /100 | #105 | Exceptional 15.7% |
| Immigrants | Poland | 95.8 /100 | #106 | Exceptional 15.7% |
| Native Hawaiians | 95.8 /100 | #107 | Exceptional 15.7% |
| Pakistanis | 95.7 /100 | #108 | Exceptional 15.7% |
| Turks | 95.1 /100 | #109 | Exceptional 15.8% |
| Immigrants | Africa | 95.1 /100 | #110 | Exceptional 15.8% |
| Bulgarians | 94.8 /100 | #111 | Exceptional 15.8% |
Demographics Similar to Immigrants from Bangladesh by Single Father Poverty
In terms of single father poverty, the demographic groups most similar to Immigrants from Bangladesh are Guyanese (16.3%, a difference of 0.0%), Immigrants from Europe (16.3%, a difference of 0.010%), Immigrants from Costa Rica (16.3%, a difference of 0.030%), Ugandan (16.3%, a difference of 0.040%), and Yugoslavian (16.3%, a difference of 0.050%).
| Demographics | Rating | Rank | Single Father Poverty |
| Portuguese | 62.3 /100 | #158 | Good 16.2% |
| Belizeans | 59.9 /100 | #159 | Average 16.2% |
| Immigrants | Sudan | 59.8 /100 | #160 | Average 16.2% |
| Estonians | 56.7 /100 | #161 | Average 16.2% |
| Ugandans | 55.9 /100 | #162 | Average 16.3% |
| Immigrants | Costa Rica | 55.7 /100 | #163 | Average 16.3% |
| Guyanese | 55.2 /100 | #164 | Average 16.3% |
| Immigrants | Bangladesh | 55.1 /100 | #165 | Average 16.3% |
| Immigrants | Europe | 54.8 /100 | #166 | Average 16.3% |
| Yugoslavians | 53.9 /100 | #167 | Average 16.3% |
| Costa Ricans | 53.6 /100 | #168 | Average 16.3% |
| Northern Europeans | 52.8 /100 | #169 | Average 16.3% |
| Scandinavians | 52.3 /100 | #170 | Average 16.3% |
| Immigrants | Morocco | 50.7 /100 | #171 | Average 16.3% |
| Immigrants | Sierra Leone | 50.1 /100 | #172 | Average 16.3% |