Assyrian/Chaldean/Syriac vs Immigrants from Brazil Unemployment Among Women with Children Ages 6 to 17 years
COMPARE
Assyrian/Chaldean/Syriac
Immigrants from Brazil
Unemployment Among Women with Children Ages 6 to 17 years
Unemployment Among Women with Children Ages 6 to 17 years Comparison
Assyrians/Chaldeans/Syriacs
Immigrants from Brazil
7.2%
UNEMPLOYMENT AMONG WOMEN WITH CHILDREN AGES 6 TO 17 YEARS
100.0/ 100
METRIC RATING
9th/ 347
METRIC RANK
9.0%
UNEMPLOYMENT AMONG WOMEN WITH CHILDREN AGES 6 TO 17 YEARS
51.0/ 100
METRIC RATING
173rd/ 347
METRIC RANK
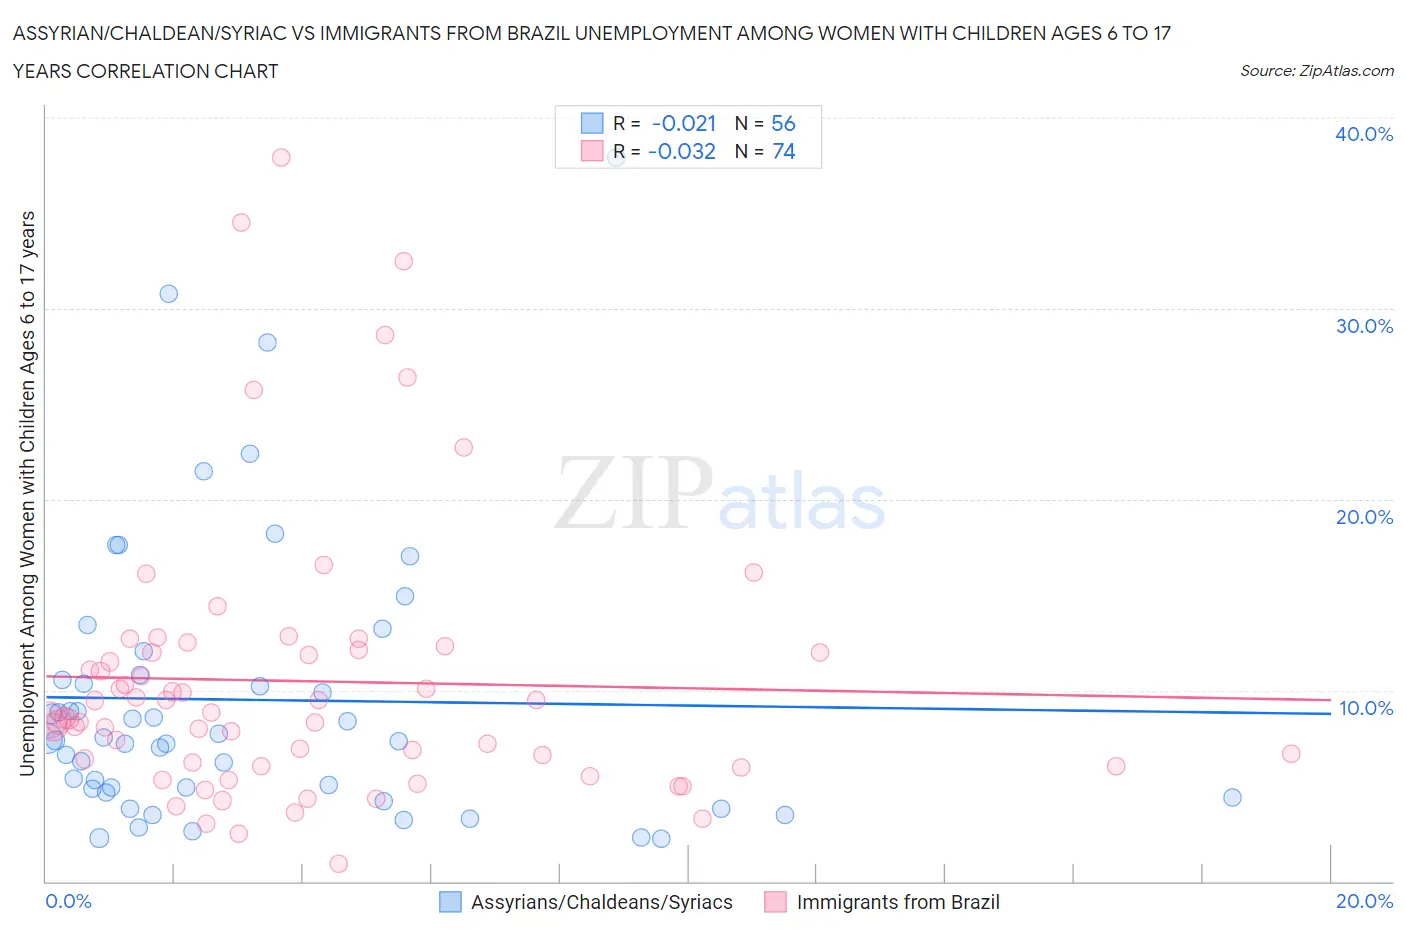
Assyrian/Chaldean/Syriac vs Immigrants from Brazil Unemployment Among Women with Children Ages 6 to 17 years Correlation Chart
The statistical analysis conducted on geographies consisting of 94,071,494 people shows no correlation between the proportion of Assyrians/Chaldeans/Syriacs and unemployment rate among women with children between the ages 6 and 17 in the United States with a correlation coefficient (R) of -0.021 and weighted average of 7.2%. Similarly, the statistical analysis conducted on geographies consisting of 251,390,083 people shows no correlation between the proportion of Immigrants from Brazil and unemployment rate among women with children between the ages 6 and 17 in the United States with a correlation coefficient (R) of -0.032 and weighted average of 9.0%, a difference of 24.3%.
Unemployment Among Women with Children Ages 6 to 17 years Correlation Summary
| Measurement | Assyrian/Chaldean/Syriac | Immigrants from Brazil |
| Minimum | 2.2% | 0.90% |
| Maximum | 37.9% | 37.9% |
| Range | 35.7% | 37.0% |
| Mean | 9.5% | 10.5% |
| Median | 7.4% | 8.5% |
| Interquartile 25% (IQ1) | 4.7% | 6.1% |
| Interquartile 75% (IQ3) | 10.7% | 12.0% |
| Interquartile Range (IQR) | 5.9% | 5.9% |
| Standard Deviation (Sample) | 7.4% | 7.2% |
| Standard Deviation (Population) | 7.3% | 7.2% |
Similar Demographics by Unemployment Among Women with Children Ages 6 to 17 years
Demographics Similar to Assyrians/Chaldeans/Syriacs by Unemployment Among Women with Children Ages 6 to 17 years
In terms of unemployment among women with children ages 6 to 17 years, the demographic groups most similar to Assyrians/Chaldeans/Syriacs are Immigrants from Hong Kong (7.2%, a difference of 0.31%), Immigrants from Fiji (7.3%, a difference of 0.97%), Immigrants from Taiwan (7.3%, a difference of 1.7%), Soviet Union (7.1%, a difference of 1.7%), and Tlingit-Haida (7.1%, a difference of 1.8%).
| Demographics | Rating | Rank | Unemployment Among Women with Children Ages 6 to 17 years |
| Fijians | 100.0 /100 | #2 | Exceptional 6.6% |
| Tongans | 100.0 /100 | #3 | Exceptional 6.7% |
| Ute | 100.0 /100 | #4 | Exceptional 7.0% |
| Okinawans | 100.0 /100 | #5 | Exceptional 7.0% |
| Tlingit-Haida | 100.0 /100 | #6 | Exceptional 7.1% |
| Soviet Union | 100.0 /100 | #7 | Exceptional 7.1% |
| Immigrants | Hong Kong | 100.0 /100 | #8 | Exceptional 7.2% |
| Assyrians/Chaldeans/Syriacs | 100.0 /100 | #9 | Exceptional 7.2% |
| Immigrants | Fiji | 100.0 /100 | #10 | Exceptional 7.3% |
| Immigrants | Taiwan | 100.0 /100 | #11 | Exceptional 7.3% |
| Bangladeshis | 100.0 /100 | #12 | Exceptional 7.4% |
| Indonesians | 100.0 /100 | #13 | Exceptional 7.4% |
| Sudanese | 100.0 /100 | #14 | Exceptional 7.4% |
| Puget Sound Salish | 100.0 /100 | #15 | Exceptional 7.5% |
| Immigrants | Burma/Myanmar | 100.0 /100 | #16 | Exceptional 7.5% |
Demographics Similar to Immigrants from Brazil by Unemployment Among Women with Children Ages 6 to 17 years
In terms of unemployment among women with children ages 6 to 17 years, the demographic groups most similar to Immigrants from Brazil are Jordanian (9.0%, a difference of 0.050%), Immigrants from West Indies (9.0%, a difference of 0.050%), Immigrants from Costa Rica (9.0%, a difference of 0.050%), Turkish (8.9%, a difference of 0.14%), and British (8.9%, a difference of 0.19%).
| Demographics | Rating | Rank | Unemployment Among Women with Children Ages 6 to 17 years |
| Moroccans | 58.3 /100 | #166 | Average 8.9% |
| Immigrants | England | 57.7 /100 | #167 | Average 8.9% |
| Immigrants | Croatia | 57.1 /100 | #168 | Average 8.9% |
| British | 55.2 /100 | #169 | Average 8.9% |
| Turks | 54.1 /100 | #170 | Average 8.9% |
| Jordanians | 52.2 /100 | #171 | Average 9.0% |
| Immigrants | West Indies | 52.2 /100 | #172 | Average 9.0% |
| Immigrants | Brazil | 51.0 /100 | #173 | Average 9.0% |
| Immigrants | Costa Rica | 50.0 /100 | #174 | Average 9.0% |
| Immigrants | Sierra Leone | 45.9 /100 | #175 | Average 9.0% |
| Immigrants | Italy | 43.7 /100 | #176 | Average 9.0% |
| Immigrants | Jordan | 41.6 /100 | #177 | Average 9.0% |
| Menominee | 39.3 /100 | #178 | Fair 9.0% |
| Immigrants | Zaire | 38.3 /100 | #179 | Fair 9.0% |
| Ethiopians | 37.6 /100 | #180 | Fair 9.0% |