Barbadian vs Immigrants from Morocco 5th Grade
COMPARE
Barbadian
Immigrants from Morocco
5th Grade
5th Grade Comparison
Barbadians
Immigrants from Morocco
96.6%
5TH GRADE
0.1/ 100
METRIC RATING
282nd/ 347
METRIC RANK
97.1%
5TH GRADE
7.5/ 100
METRIC RATING
215th/ 347
METRIC RANK
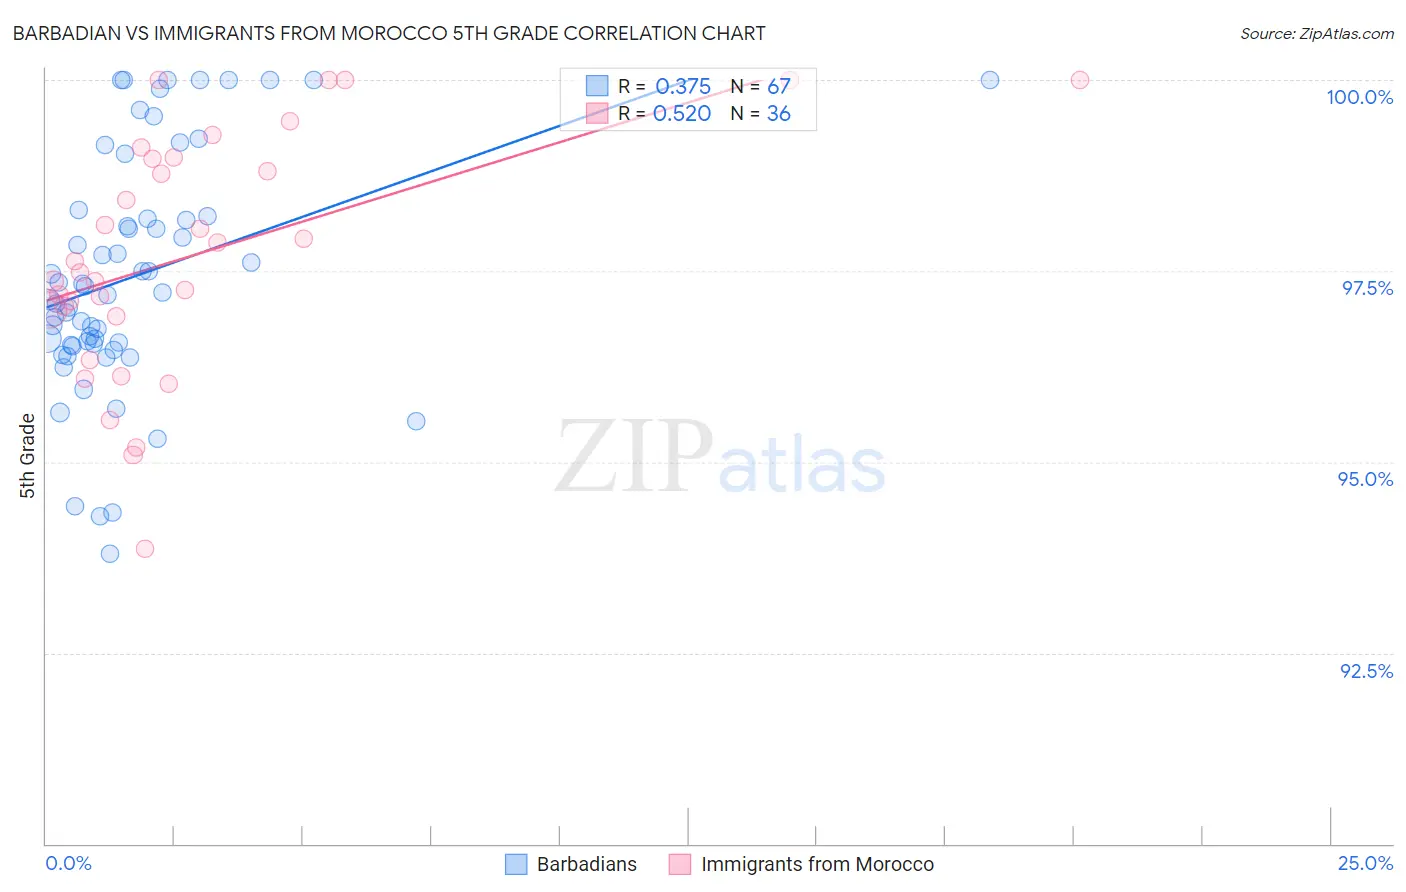
Barbadian vs Immigrants from Morocco 5th Grade Correlation Chart
The statistical analysis conducted on geographies consisting of 141,304,590 people shows a mild positive correlation between the proportion of Barbadians and percentage of population with at least 5th grade education in the United States with a correlation coefficient (R) of 0.375 and weighted average of 96.6%. Similarly, the statistical analysis conducted on geographies consisting of 178,910,634 people shows a substantial positive correlation between the proportion of Immigrants from Morocco and percentage of population with at least 5th grade education in the United States with a correlation coefficient (R) of 0.520 and weighted average of 97.1%, a difference of 0.48%.
5th Grade Correlation Summary
| Measurement | Barbadian | Immigrants from Morocco |
| Minimum | 93.8% | 93.9% |
| Maximum | 100.0% | 100.0% |
| Range | 6.2% | 6.1% |
| Mean | 97.4% | 97.7% |
| Median | 97.2% | 97.6% |
| Interquartile 25% (IQ1) | 96.5% | 96.9% |
| Interquartile 75% (IQ3) | 98.2% | 99.0% |
| Interquartile Range (IQR) | 1.7% | 2.0% |
| Standard Deviation (Sample) | 1.5% | 1.6% |
| Standard Deviation (Population) | 1.5% | 1.5% |
Similar Demographics by 5th Grade
Demographics Similar to Barbadians by 5th Grade
In terms of 5th grade, the demographic groups most similar to Barbadians are Immigrants from Western Africa (96.6%, a difference of 0.0%), Houma (96.6%, a difference of 0.0%), Fijian (96.6%, a difference of 0.0%), Immigrants from Philippines (96.6%, a difference of 0.010%), and Immigrants from Trinidad and Tobago (96.6%, a difference of 0.010%).
| Demographics | Rating | Rank | 5th Grade |
| Immigrants | Peru | 0.1 /100 | #275 | Tragic 96.6% |
| Cubans | 0.1 /100 | #276 | Tragic 96.6% |
| Immigrants | Bolivia | 0.1 /100 | #277 | Tragic 96.6% |
| Immigrants | Ghana | 0.1 /100 | #278 | Tragic 96.6% |
| Immigrants | Philippines | 0.1 /100 | #279 | Tragic 96.6% |
| Immigrants | Western Africa | 0.1 /100 | #280 | Tragic 96.6% |
| Houma | 0.1 /100 | #281 | Tragic 96.6% |
| Barbadians | 0.1 /100 | #282 | Tragic 96.6% |
| Fijians | 0.1 /100 | #283 | Tragic 96.6% |
| Immigrants | Trinidad and Tobago | 0.1 /100 | #284 | Tragic 96.6% |
| Immigrants | St. Vincent and the Grenadines | 0.1 /100 | #285 | Tragic 96.6% |
| Immigrants | Thailand | 0.1 /100 | #286 | Tragic 96.6% |
| Immigrants | Afghanistan | 0.1 /100 | #287 | Tragic 96.6% |
| Immigrants | Barbados | 0.0 /100 | #288 | Tragic 96.6% |
| Immigrants | West Indies | 0.0 /100 | #289 | Tragic 96.5% |
Demographics Similar to Immigrants from Morocco by 5th Grade
In terms of 5th grade, the demographic groups most similar to Immigrants from Morocco are Portuguese (97.1%, a difference of 0.0%), Costa Rican (97.1%, a difference of 0.0%), Samoan (97.1%, a difference of 0.010%), Immigrants from Iraq (97.1%, a difference of 0.010%), and Sudanese (97.1%, a difference of 0.010%).
| Demographics | Rating | Rank | 5th Grade |
| Laotians | 10.8 /100 | #208 | Poor 97.1% |
| Immigrants | Nepal | 10.3 /100 | #209 | Poor 97.1% |
| Immigrants | Oceania | 10.0 /100 | #210 | Poor 97.1% |
| Samoans | 8.5 /100 | #211 | Tragic 97.1% |
| Immigrants | Iraq | 8.3 /100 | #212 | Tragic 97.1% |
| Portuguese | 7.8 /100 | #213 | Tragic 97.1% |
| Costa Ricans | 7.7 /100 | #214 | Tragic 97.1% |
| Immigrants | Morocco | 7.5 /100 | #215 | Tragic 97.1% |
| Sudanese | 7.0 /100 | #216 | Tragic 97.1% |
| Immigrants | Lebanon | 6.8 /100 | #217 | Tragic 97.1% |
| Immigrants | Sudan | 6.5 /100 | #218 | Tragic 97.1% |
| Immigrants | Syria | 6.4 /100 | #219 | Tragic 97.1% |
| Immigrants | Southern Europe | 6.3 /100 | #220 | Tragic 97.1% |
| Sierra Leoneans | 6.0 /100 | #221 | Tragic 97.1% |
| Immigrants | Panama | 5.7 /100 | #222 | Tragic 97.0% |