Asian vs Immigrants from Japan 8th Grade
COMPARE
Asian
Immigrants from Japan
8th Grade
8th Grade Comparison
Asians
Immigrants from Japan
95.2%
8TH GRADE
3.5/ 100
METRIC RATING
231st/ 347
METRIC RANK
96.2%
8TH GRADE
96.5/ 100
METRIC RATING
114th/ 347
METRIC RANK
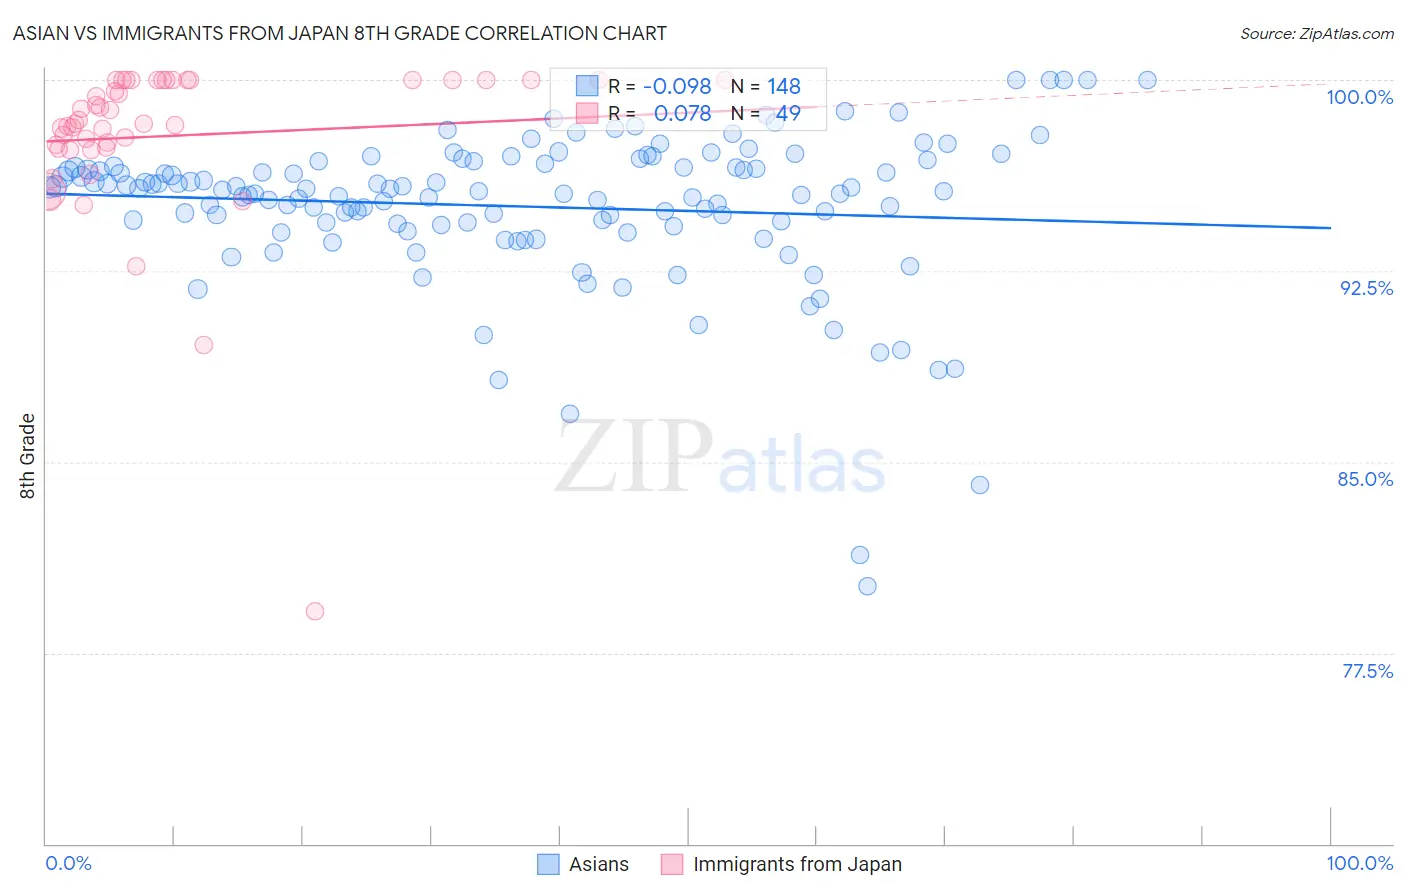
Asian vs Immigrants from Japan 8th Grade Correlation Chart
The statistical analysis conducted on geographies consisting of 550,917,032 people shows a slight negative correlation between the proportion of Asians and percentage of population with at least 8th grade education in the United States with a correlation coefficient (R) of -0.098 and weighted average of 95.2%. Similarly, the statistical analysis conducted on geographies consisting of 340,148,942 people shows a slight positive correlation between the proportion of Immigrants from Japan and percentage of population with at least 8th grade education in the United States with a correlation coefficient (R) of 0.078 and weighted average of 96.2%, a difference of 1.1%.
8th Grade Correlation Summary
| Measurement | Asian | Immigrants from Japan |
| Minimum | 80.1% | 79.1% |
| Maximum | 100.0% | 100.0% |
| Range | 19.9% | 20.9% |
| Mean | 95.0% | 97.8% |
| Median | 95.6% | 98.3% |
| Interquartile 25% (IQ1) | 94.3% | 97.3% |
| Interquartile 75% (IQ3) | 96.6% | 100.0% |
| Interquartile Range (IQR) | 2.3% | 2.7% |
| Standard Deviation (Sample) | 3.0% | 3.4% |
| Standard Deviation (Population) | 3.0% | 3.4% |
Similar Demographics by 8th Grade
Demographics Similar to Asians by 8th Grade
In terms of 8th grade, the demographic groups most similar to Asians are Indian (Asian) (95.2%, a difference of 0.010%), Immigrants from Asia (95.2%, a difference of 0.020%), Costa Rican (95.2%, a difference of 0.020%), Immigrants from Panama (95.2%, a difference of 0.030%), and Nigerian (95.2%, a difference of 0.030%).
| Demographics | Rating | Rank | 8th Grade |
| Immigrants | Western Asia | 6.0 /100 | #224 | Tragic 95.3% |
| Sub-Saharan Africans | 6.0 /100 | #225 | Tragic 95.3% |
| Navajo | 5.7 /100 | #226 | Tragic 95.3% |
| Bahamians | 5.6 /100 | #227 | Tragic 95.3% |
| Immigrants | Eastern Africa | 5.6 /100 | #228 | Tragic 95.3% |
| Immigrants | Indonesia | 4.4 /100 | #229 | Tragic 95.3% |
| Immigrants | Panama | 4.1 /100 | #230 | Tragic 95.2% |
| Asians | 3.5 /100 | #231 | Tragic 95.2% |
| Indians (Asian) | 3.3 /100 | #232 | Tragic 95.2% |
| Immigrants | Asia | 3.1 /100 | #233 | Tragic 95.2% |
| Costa Ricans | 3.0 /100 | #234 | Tragic 95.2% |
| Nigerians | 2.9 /100 | #235 | Tragic 95.2% |
| Senegalese | 2.7 /100 | #236 | Tragic 95.2% |
| Immigrants | Africa | 2.7 /100 | #237 | Tragic 95.2% |
| Natives/Alaskans | 2.3 /100 | #238 | Tragic 95.2% |
Demographics Similar to Immigrants from Japan by 8th Grade
In terms of 8th grade, the demographic groups most similar to Immigrants from Japan are Immigrants from Moldova (96.2%, a difference of 0.0%), Shoshone (96.3%, a difference of 0.010%), Syrian (96.3%, a difference of 0.010%), Immigrants from Zimbabwe (96.3%, a difference of 0.010%), and Nonimmigrants (96.2%, a difference of 0.020%).
| Demographics | Rating | Rank | 8th Grade |
| Immigrants | Latvia | 97.8 /100 | #107 | Exceptional 96.3% |
| Lebanese | 97.5 /100 | #108 | Exceptional 96.3% |
| Iroquois | 97.5 /100 | #109 | Exceptional 96.3% |
| Cajuns | 97.1 /100 | #110 | Exceptional 96.3% |
| Shoshone | 96.8 /100 | #111 | Exceptional 96.3% |
| Syrians | 96.7 /100 | #112 | Exceptional 96.3% |
| Immigrants | Zimbabwe | 96.7 /100 | #113 | Exceptional 96.3% |
| Immigrants | Japan | 96.5 /100 | #114 | Exceptional 96.2% |
| Immigrants | Moldova | 96.5 /100 | #115 | Exceptional 96.2% |
| Immigrants | Nonimmigrants | 96.0 /100 | #116 | Exceptional 96.2% |
| Immigrants | Croatia | 96.0 /100 | #117 | Exceptional 96.2% |
| Immigrants | Norway | 95.7 /100 | #118 | Exceptional 96.2% |
| Immigrants | Switzerland | 95.3 /100 | #119 | Exceptional 96.2% |
| Immigrants | France | 95.3 /100 | #120 | Exceptional 96.2% |
| Immigrants | Bulgaria | 95.3 /100 | #121 | Exceptional 96.2% |