Immigrants from Senegal vs Immigrants from Latvia Master's Degree
COMPARE
Immigrants from Senegal
Immigrants from Latvia
Master's Degree
Master's Degree Comparison
Immigrants from Senegal
Immigrants from Latvia
15.5%
MASTER'S DEGREE
78.2/ 100
METRIC RATING
148th/ 347
METRIC RANK
19.1%
MASTER'S DEGREE
100.0/ 100
METRIC RATING
41st/ 347
METRIC RANK
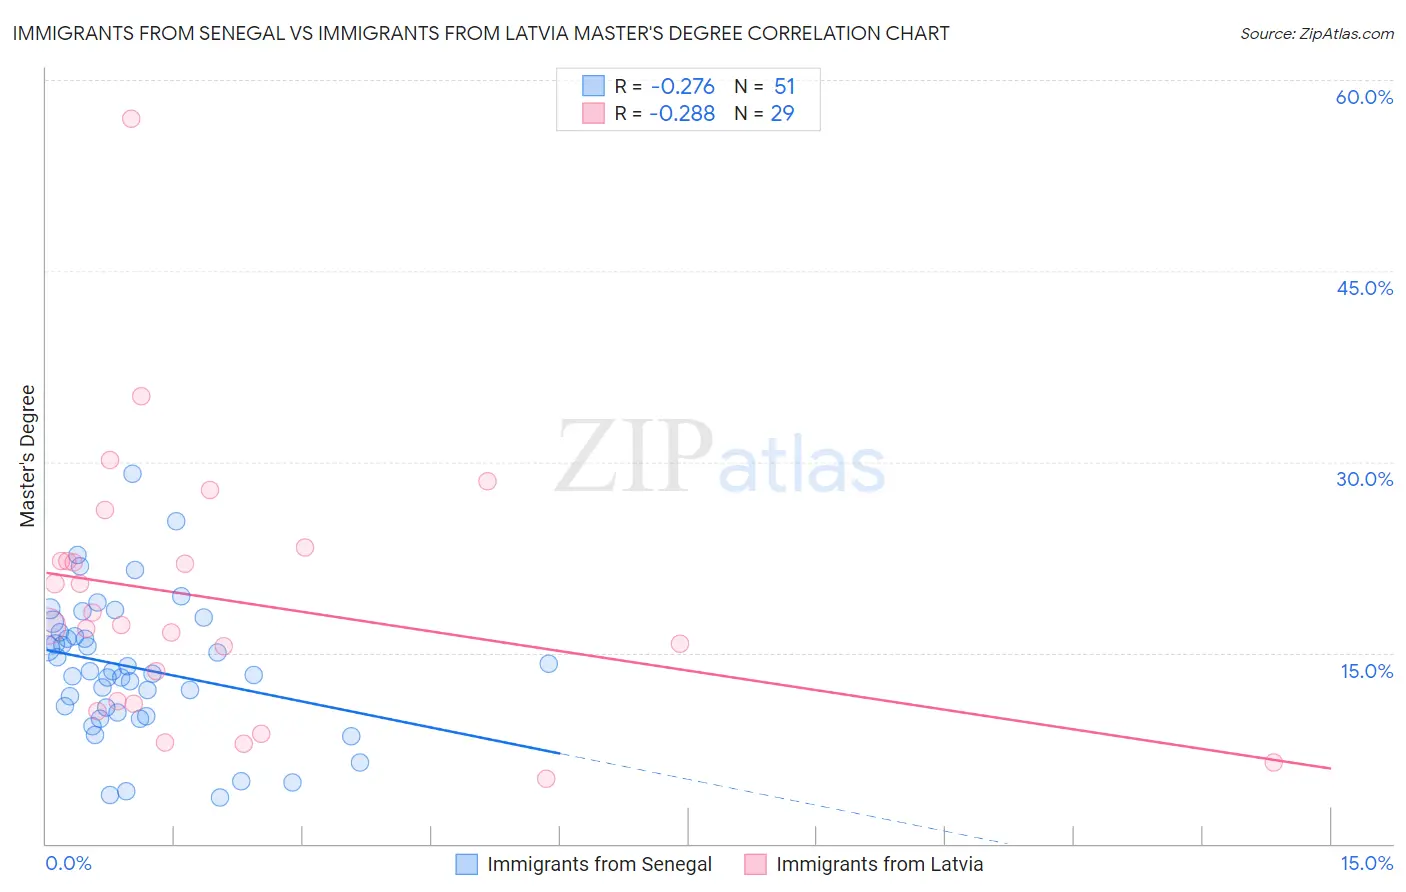
Immigrants from Senegal vs Immigrants from Latvia Master's Degree Correlation Chart
The statistical analysis conducted on geographies consisting of 90,124,695 people shows a weak negative correlation between the proportion of Immigrants from Senegal and percentage of population with at least master's degree education in the United States with a correlation coefficient (R) of -0.276 and weighted average of 15.5%. Similarly, the statistical analysis conducted on geographies consisting of 113,728,237 people shows a weak negative correlation between the proportion of Immigrants from Latvia and percentage of population with at least master's degree education in the United States with a correlation coefficient (R) of -0.288 and weighted average of 19.1%, a difference of 22.7%.
Master's Degree Correlation Summary
| Measurement | Immigrants from Senegal | Immigrants from Latvia |
| Minimum | 3.7% | 5.1% |
| Maximum | 29.1% | 56.9% |
| Range | 25.4% | 51.8% |
| Mean | 13.8% | 19.2% |
| Median | 13.5% | 17.2% |
| Interquartile 25% (IQ1) | 10.3% | 11.1% |
| Interquartile 75% (IQ3) | 16.6% | 22.7% |
| Interquartile Range (IQR) | 6.3% | 11.6% |
| Standard Deviation (Sample) | 5.4% | 10.5% |
| Standard Deviation (Population) | 5.3% | 10.3% |
Similar Demographics by Master's Degree
Demographics Similar to Immigrants from Senegal by Master's Degree
In terms of master's degree, the demographic groups most similar to Immigrants from Senegal are Ghanaian (15.5%, a difference of 0.010%), Slovene (15.5%, a difference of 0.040%), Iraqi (15.5%, a difference of 0.16%), Hungarian (15.6%, a difference of 0.17%), and Immigrants from Afghanistan (15.6%, a difference of 0.21%).
| Demographics | Rating | Rank | Master's Degree |
| Poles | 85.0 /100 | #141 | Excellent 15.7% |
| Immigrants | Africa | 84.0 /100 | #142 | Excellent 15.7% |
| Immigrants | Venezuela | 83.6 /100 | #143 | Excellent 15.7% |
| Canadians | 83.3 /100 | #144 | Excellent 15.7% |
| South Americans | 81.3 /100 | #145 | Excellent 15.6% |
| Immigrants | Afghanistan | 79.4 /100 | #146 | Good 15.6% |
| Hungarians | 79.1 /100 | #147 | Good 15.6% |
| Immigrants | Senegal | 78.2 /100 | #148 | Good 15.5% |
| Ghanaians | 78.2 /100 | #149 | Good 15.5% |
| Slovenes | 78.0 /100 | #150 | Good 15.5% |
| Iraqis | 77.3 /100 | #151 | Good 15.5% |
| Slavs | 77.0 /100 | #152 | Good 15.5% |
| Icelanders | 76.8 /100 | #153 | Good 15.5% |
| Immigrants | South America | 76.3 /100 | #154 | Good 15.5% |
| Immigrants | Bangladesh | 76.1 /100 | #155 | Good 15.5% |
Demographics Similar to Immigrants from Latvia by Master's Degree
In terms of master's degree, the demographic groups most similar to Immigrants from Latvia are Immigrants from Bolivia (19.1%, a difference of 0.35%), Immigrants from Saudi Arabia (19.0%, a difference of 0.43%), Immigrants from Greece (19.0%, a difference of 0.44%), Immigrants from Spain (19.1%, a difference of 0.47%), and Immigrants from Malaysia (18.9%, a difference of 0.72%).
| Demographics | Rating | Rank | Master's Degree |
| Immigrants | Denmark | 100.0 /100 | #34 | Exceptional 19.5% |
| Immigrants | Northern Europe | 100.0 /100 | #35 | Exceptional 19.5% |
| Immigrants | Russia | 100.0 /100 | #36 | Exceptional 19.4% |
| Mongolians | 100.0 /100 | #37 | Exceptional 19.4% |
| Bolivians | 100.0 /100 | #38 | Exceptional 19.3% |
| Immigrants | Spain | 100.0 /100 | #39 | Exceptional 19.1% |
| Immigrants | Bolivia | 100.0 /100 | #40 | Exceptional 19.1% |
| Immigrants | Latvia | 100.0 /100 | #41 | Exceptional 19.1% |
| Immigrants | Saudi Arabia | 100.0 /100 | #42 | Exceptional 19.0% |
| Immigrants | Greece | 100.0 /100 | #43 | Exceptional 19.0% |
| Immigrants | Malaysia | 100.0 /100 | #44 | Exceptional 18.9% |
| Immigrants | Belarus | 100.0 /100 | #45 | Exceptional 18.9% |
| Immigrants | Norway | 100.0 /100 | #46 | Exceptional 18.8% |
| Immigrants | Austria | 100.0 /100 | #47 | Exceptional 18.8% |
| Paraguayans | 100.0 /100 | #48 | Exceptional 18.8% |