Brazilian vs Immigrants from Latvia Master's Degree
COMPARE
Brazilian
Immigrants from Latvia
Master's Degree
Master's Degree Comparison
Brazilians
Immigrants from Latvia
16.5%
MASTER'S DEGREE
96.8/ 100
METRIC RATING
118th/ 347
METRIC RANK
19.1%
MASTER'S DEGREE
100.0/ 100
METRIC RATING
41st/ 347
METRIC RANK
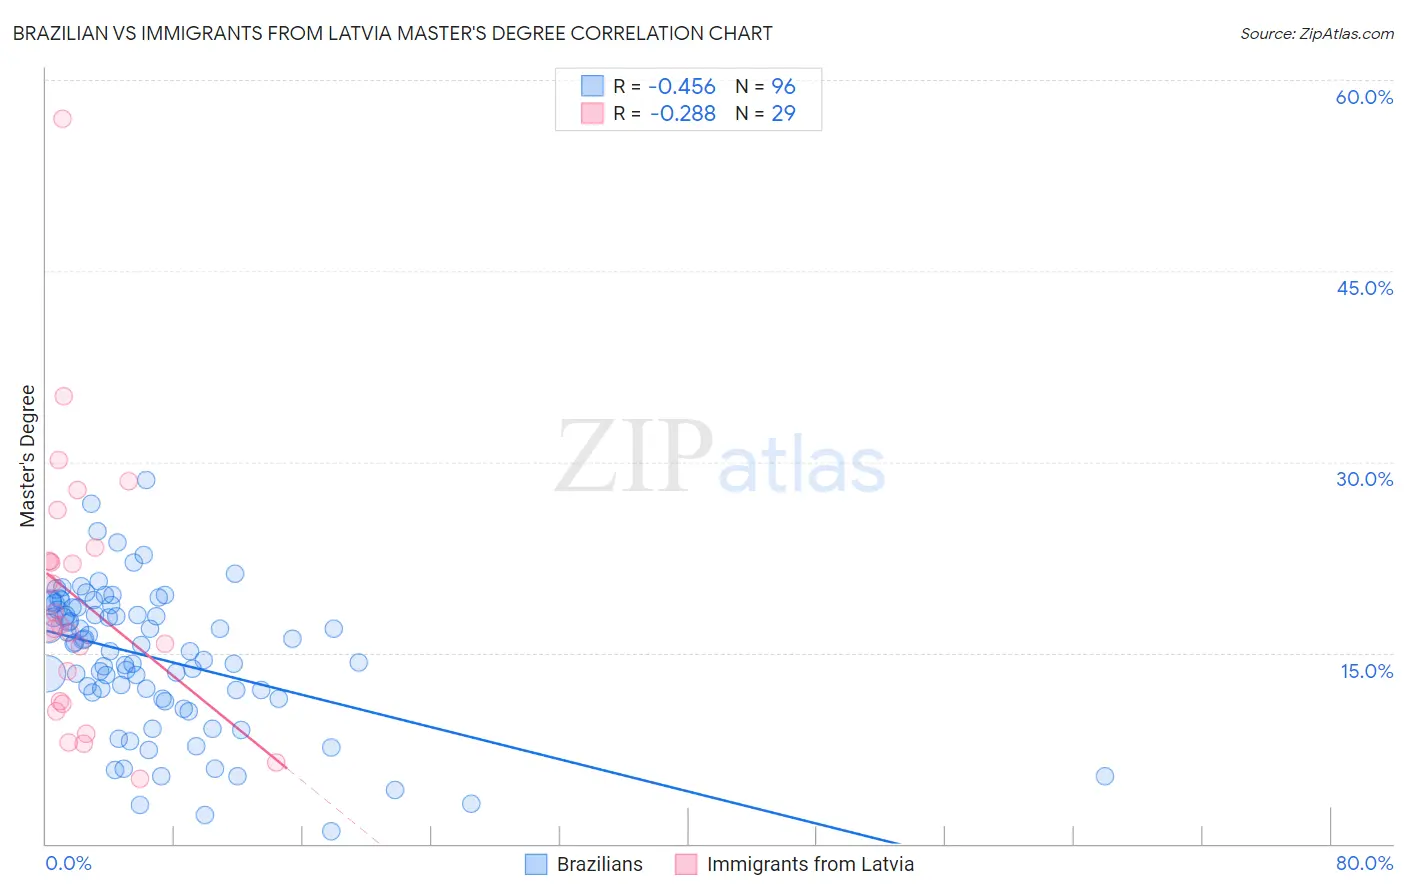
Brazilian vs Immigrants from Latvia Master's Degree Correlation Chart
The statistical analysis conducted on geographies consisting of 323,872,628 people shows a moderate negative correlation between the proportion of Brazilians and percentage of population with at least master's degree education in the United States with a correlation coefficient (R) of -0.456 and weighted average of 16.5%. Similarly, the statistical analysis conducted on geographies consisting of 113,728,237 people shows a weak negative correlation between the proportion of Immigrants from Latvia and percentage of population with at least master's degree education in the United States with a correlation coefficient (R) of -0.288 and weighted average of 19.1%, a difference of 15.1%.
Master's Degree Correlation Summary
| Measurement | Brazilian | Immigrants from Latvia |
| Minimum | 0.97% | 5.1% |
| Maximum | 28.6% | 56.9% |
| Range | 27.6% | 51.8% |
| Mean | 14.6% | 19.2% |
| Median | 15.7% | 17.2% |
| Interquartile 25% (IQ1) | 11.6% | 11.1% |
| Interquartile 75% (IQ3) | 18.6% | 22.7% |
| Interquartile Range (IQR) | 7.0% | 11.6% |
| Standard Deviation (Sample) | 5.5% | 10.5% |
| Standard Deviation (Population) | 5.5% | 10.3% |
Similar Demographics by Master's Degree
Demographics Similar to Brazilians by Master's Degree
In terms of master's degree, the demographic groups most similar to Brazilians are Jordanian (16.5%, a difference of 0.23%), Lebanese (16.5%, a difference of 0.33%), Immigrants from Moldova (16.6%, a difference of 0.42%), Immigrants from Southern Europe (16.6%, a difference of 0.43%), and Afghan (16.5%, a difference of 0.53%).
| Demographics | Rating | Rank | Master's Degree |
| Austrians | 97.8 /100 | #111 | Exceptional 16.7% |
| Macedonians | 97.7 /100 | #112 | Exceptional 16.7% |
| Arabs | 97.7 /100 | #113 | Exceptional 16.7% |
| Northern Europeans | 97.6 /100 | #114 | Exceptional 16.7% |
| Immigrants | Uganda | 97.3 /100 | #115 | Exceptional 16.6% |
| Immigrants | Southern Europe | 97.2 /100 | #116 | Exceptional 16.6% |
| Immigrants | Moldova | 97.2 /100 | #117 | Exceptional 16.6% |
| Brazilians | 96.8 /100 | #118 | Exceptional 16.5% |
| Jordanians | 96.5 /100 | #119 | Exceptional 16.5% |
| Lebanese | 96.4 /100 | #120 | Exceptional 16.5% |
| Afghans | 96.2 /100 | #121 | Exceptional 16.5% |
| British | 95.6 /100 | #122 | Exceptional 16.4% |
| Croatians | 95.6 /100 | #123 | Exceptional 16.4% |
| Immigrants | Eritrea | 95.5 /100 | #124 | Exceptional 16.4% |
| Italians | 95.4 /100 | #125 | Exceptional 16.4% |
Demographics Similar to Immigrants from Latvia by Master's Degree
In terms of master's degree, the demographic groups most similar to Immigrants from Latvia are Immigrants from Bolivia (19.1%, a difference of 0.35%), Immigrants from Saudi Arabia (19.0%, a difference of 0.43%), Immigrants from Greece (19.0%, a difference of 0.44%), Immigrants from Spain (19.1%, a difference of 0.47%), and Immigrants from Malaysia (18.9%, a difference of 0.72%).
| Demographics | Rating | Rank | Master's Degree |
| Immigrants | Denmark | 100.0 /100 | #34 | Exceptional 19.5% |
| Immigrants | Northern Europe | 100.0 /100 | #35 | Exceptional 19.5% |
| Immigrants | Russia | 100.0 /100 | #36 | Exceptional 19.4% |
| Mongolians | 100.0 /100 | #37 | Exceptional 19.4% |
| Bolivians | 100.0 /100 | #38 | Exceptional 19.3% |
| Immigrants | Spain | 100.0 /100 | #39 | Exceptional 19.1% |
| Immigrants | Bolivia | 100.0 /100 | #40 | Exceptional 19.1% |
| Immigrants | Latvia | 100.0 /100 | #41 | Exceptional 19.1% |
| Immigrants | Saudi Arabia | 100.0 /100 | #42 | Exceptional 19.0% |
| Immigrants | Greece | 100.0 /100 | #43 | Exceptional 19.0% |
| Immigrants | Malaysia | 100.0 /100 | #44 | Exceptional 18.9% |
| Immigrants | Belarus | 100.0 /100 | #45 | Exceptional 18.9% |
| Immigrants | Norway | 100.0 /100 | #46 | Exceptional 18.8% |
| Immigrants | Austria | 100.0 /100 | #47 | Exceptional 18.8% |
| Paraguayans | 100.0 /100 | #48 | Exceptional 18.8% |