Kiowa vs Immigrants from Latvia Master's Degree
COMPARE
Kiowa
Immigrants from Latvia
Master's Degree
Master's Degree Comparison
Kiowa
Immigrants from Latvia
10.8%
MASTER'S DEGREE
0.0/ 100
METRIC RATING
319th/ 347
METRIC RANK
19.1%
MASTER'S DEGREE
100.0/ 100
METRIC RATING
41st/ 347
METRIC RANK
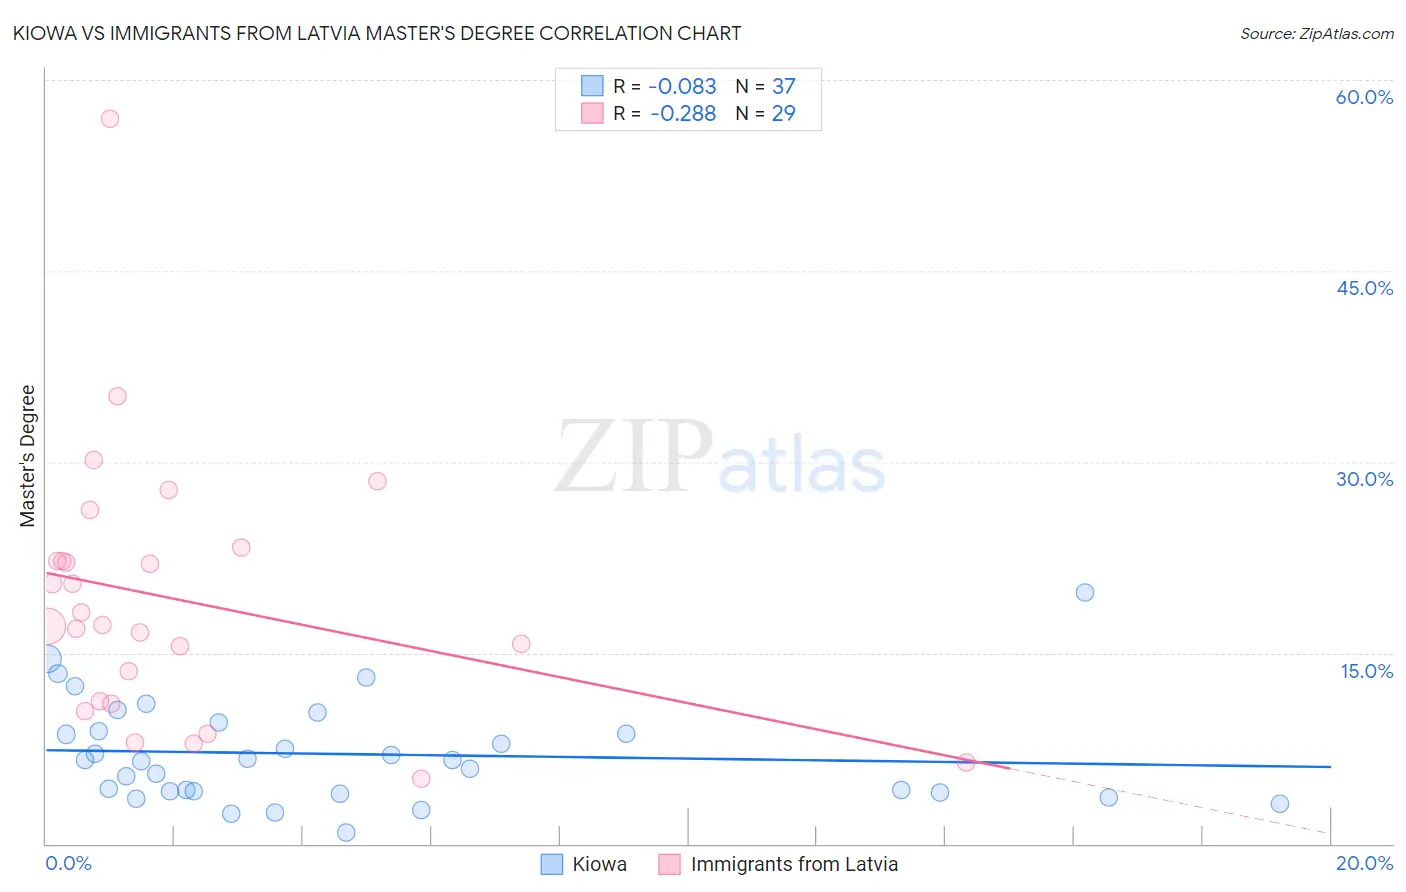
Kiowa vs Immigrants from Latvia Master's Degree Correlation Chart
The statistical analysis conducted on geographies consisting of 56,098,690 people shows a slight negative correlation between the proportion of Kiowa and percentage of population with at least master's degree education in the United States with a correlation coefficient (R) of -0.083 and weighted average of 10.8%. Similarly, the statistical analysis conducted on geographies consisting of 113,728,237 people shows a weak negative correlation between the proportion of Immigrants from Latvia and percentage of population with at least master's degree education in the United States with a correlation coefficient (R) of -0.288 and weighted average of 19.1%, a difference of 75.9%.
Master's Degree Correlation Summary
| Measurement | Kiowa | Immigrants from Latvia |
| Minimum | 0.84% | 5.1% |
| Maximum | 19.7% | 56.9% |
| Range | 18.9% | 51.8% |
| Mean | 7.0% | 19.2% |
| Median | 6.6% | 17.2% |
| Interquartile 25% (IQ1) | 4.1% | 11.1% |
| Interquartile 75% (IQ3) | 9.2% | 22.7% |
| Interquartile Range (IQR) | 5.1% | 11.6% |
| Standard Deviation (Sample) | 4.0% | 10.5% |
| Standard Deviation (Population) | 4.0% | 10.3% |
Similar Demographics by Master's Degree
Demographics Similar to Kiowa by Master's Degree
In terms of master's degree, the demographic groups most similar to Kiowa are Immigrants from Cuba (10.9%, a difference of 0.24%), Hopi (10.9%, a difference of 0.37%), Immigrants from Micronesia (10.8%, a difference of 0.62%), Pennsylvania German (10.7%, a difference of 0.83%), and Hispanic or Latino (10.9%, a difference of 0.91%).
| Demographics | Rating | Rank | Master's Degree |
| Choctaw | 0.0 /100 | #312 | Tragic 11.0% |
| Yaqui | 0.0 /100 | #313 | Tragic 11.0% |
| Cajuns | 0.0 /100 | #314 | Tragic 11.0% |
| Apache | 0.0 /100 | #315 | Tragic 11.0% |
| Hispanics or Latinos | 0.0 /100 | #316 | Tragic 10.9% |
| Hopi | 0.0 /100 | #317 | Tragic 10.9% |
| Immigrants | Cuba | 0.0 /100 | #318 | Tragic 10.9% |
| Kiowa | 0.0 /100 | #319 | Tragic 10.8% |
| Immigrants | Micronesia | 0.0 /100 | #320 | Tragic 10.8% |
| Pennsylvania Germans | 0.0 /100 | #321 | Tragic 10.7% |
| Sioux | 0.0 /100 | #322 | Tragic 10.7% |
| Crow | 0.0 /100 | #323 | Tragic 10.6% |
| Dutch West Indians | 0.0 /100 | #324 | Tragic 10.6% |
| Inupiat | 0.0 /100 | #325 | Tragic 10.5% |
| Creek | 0.0 /100 | #326 | Tragic 10.5% |
Demographics Similar to Immigrants from Latvia by Master's Degree
In terms of master's degree, the demographic groups most similar to Immigrants from Latvia are Immigrants from Bolivia (19.1%, a difference of 0.35%), Immigrants from Saudi Arabia (19.0%, a difference of 0.43%), Immigrants from Greece (19.0%, a difference of 0.44%), Immigrants from Spain (19.1%, a difference of 0.47%), and Immigrants from Malaysia (18.9%, a difference of 0.72%).
| Demographics | Rating | Rank | Master's Degree |
| Immigrants | Denmark | 100.0 /100 | #34 | Exceptional 19.5% |
| Immigrants | Northern Europe | 100.0 /100 | #35 | Exceptional 19.5% |
| Immigrants | Russia | 100.0 /100 | #36 | Exceptional 19.4% |
| Mongolians | 100.0 /100 | #37 | Exceptional 19.4% |
| Bolivians | 100.0 /100 | #38 | Exceptional 19.3% |
| Immigrants | Spain | 100.0 /100 | #39 | Exceptional 19.1% |
| Immigrants | Bolivia | 100.0 /100 | #40 | Exceptional 19.1% |
| Immigrants | Latvia | 100.0 /100 | #41 | Exceptional 19.1% |
| Immigrants | Saudi Arabia | 100.0 /100 | #42 | Exceptional 19.0% |
| Immigrants | Greece | 100.0 /100 | #43 | Exceptional 19.0% |
| Immigrants | Malaysia | 100.0 /100 | #44 | Exceptional 18.9% |
| Immigrants | Belarus | 100.0 /100 | #45 | Exceptional 18.9% |
| Immigrants | Norway | 100.0 /100 | #46 | Exceptional 18.8% |
| Immigrants | Austria | 100.0 /100 | #47 | Exceptional 18.8% |
| Paraguayans | 100.0 /100 | #48 | Exceptional 18.8% |