Argentinean vs Immigrants from Fiji 6th Grade
COMPARE
Argentinean
Immigrants from Fiji
6th Grade
6th Grade Comparison
Argentineans
Immigrants from Fiji
97.0%
6TH GRADE
33.0/ 100
METRIC RATING
185th/ 347
METRIC RANK
95.2%
6TH GRADE
0.0/ 100
METRIC RATING
321st/ 347
METRIC RANK
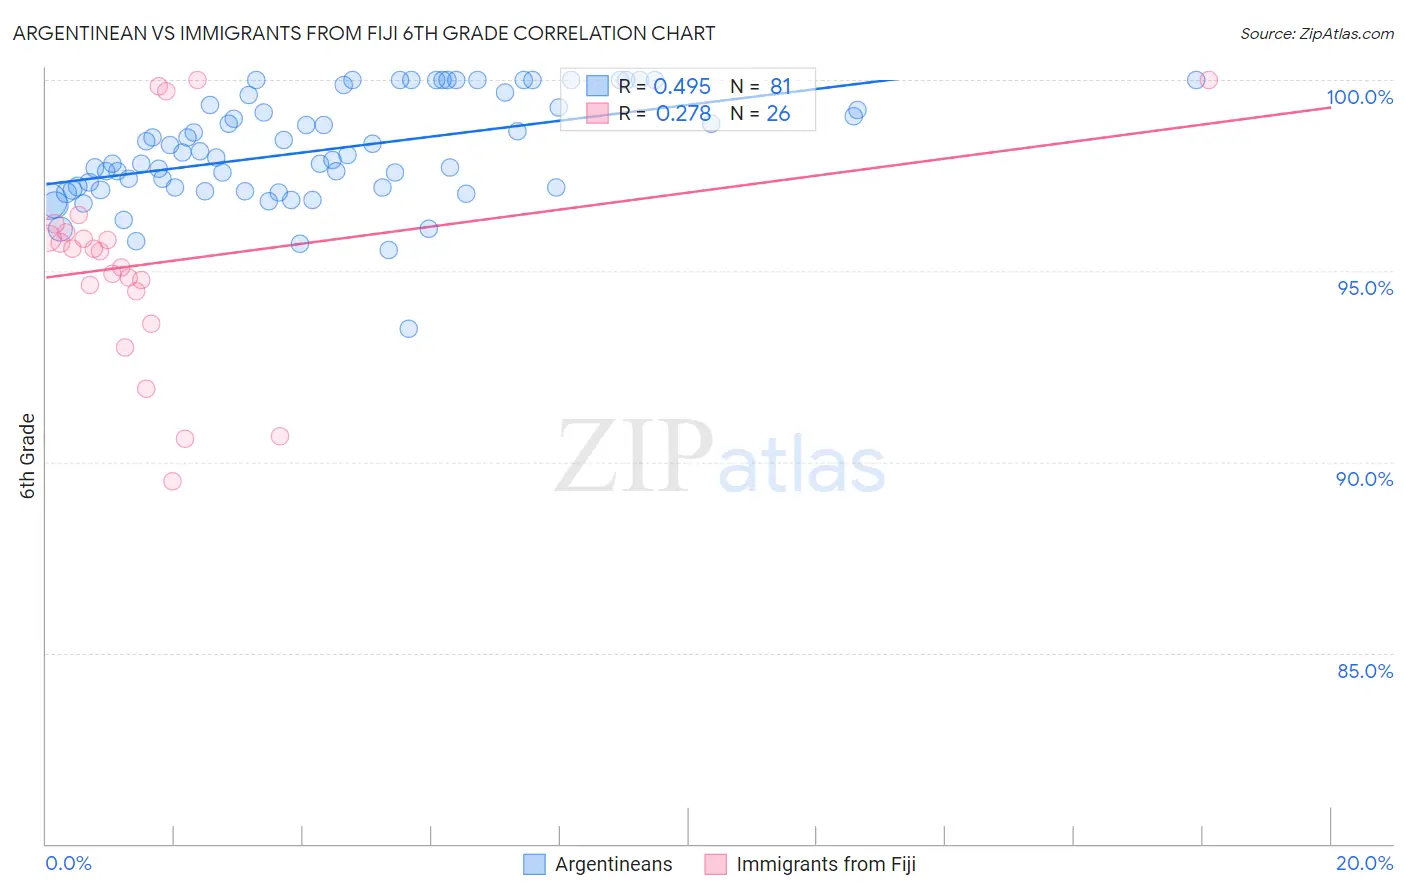
Argentinean vs Immigrants from Fiji 6th Grade Correlation Chart
The statistical analysis conducted on geographies consisting of 297,143,222 people shows a moderate positive correlation between the proportion of Argentineans and percentage of population with at least 6th grade education in the United States with a correlation coefficient (R) of 0.495 and weighted average of 97.0%. Similarly, the statistical analysis conducted on geographies consisting of 93,756,204 people shows a weak positive correlation between the proportion of Immigrants from Fiji and percentage of population with at least 6th grade education in the United States with a correlation coefficient (R) of 0.278 and weighted average of 95.2%, a difference of 1.8%.
6th Grade Correlation Summary
| Measurement | Argentinean | Immigrants from Fiji |
| Minimum | 93.5% | 89.5% |
| Maximum | 100.0% | 100.0% |
| Range | 6.5% | 10.5% |
| Mean | 98.2% | 95.2% |
| Median | 98.0% | 95.5% |
| Interquartile 25% (IQ1) | 97.2% | 94.5% |
| Interquartile 75% (IQ3) | 99.5% | 96.0% |
| Interquartile Range (IQR) | 2.3% | 1.6% |
| Standard Deviation (Sample) | 1.4% | 2.7% |
| Standard Deviation (Population) | 1.4% | 2.7% |
Similar Demographics by 6th Grade
Demographics Similar to Argentineans by 6th Grade
In terms of 6th grade, the demographic groups most similar to Argentineans are Spanish American (97.0%, a difference of 0.0%), Immigrants from Ukraine (97.0%, a difference of 0.010%), Immigrants from Venezuela (97.0%, a difference of 0.010%), Immigrants from Egypt (97.0%, a difference of 0.010%), and Guamanian/Chamorro (97.0%, a difference of 0.010%).
| Demographics | Rating | Rank | 6th Grade |
| Pakistanis | 46.0 /100 | #178 | Average 97.0% |
| Immigrants | Kenya | 45.3 /100 | #179 | Average 97.0% |
| Immigrants | Spain | 39.9 /100 | #180 | Fair 97.0% |
| Comanche | 37.9 /100 | #181 | Fair 97.0% |
| Immigrants | Ukraine | 35.6 /100 | #182 | Fair 97.0% |
| Immigrants | Venezuela | 34.5 /100 | #183 | Fair 97.0% |
| Spanish Americans | 33.5 /100 | #184 | Fair 97.0% |
| Argentineans | 33.0 /100 | #185 | Fair 97.0% |
| Immigrants | Egypt | 31.4 /100 | #186 | Fair 97.0% |
| Guamanians/Chamorros | 30.6 /100 | #187 | Fair 97.0% |
| Immigrants | Argentina | 30.4 /100 | #188 | Fair 97.0% |
| Blacks/African Americans | 30.2 /100 | #189 | Fair 97.0% |
| Dutch West Indians | 28.3 /100 | #190 | Fair 96.9% |
| Panamanians | 27.3 /100 | #191 | Fair 96.9% |
| Hawaiians | 27.0 /100 | #192 | Fair 96.9% |
Demographics Similar to Immigrants from Fiji by 6th Grade
In terms of 6th grade, the demographic groups most similar to Immigrants from Fiji are Immigrants from Cambodia (95.2%, a difference of 0.050%), Immigrants from Ecuador (95.3%, a difference of 0.060%), Central American Indian (95.1%, a difference of 0.060%), Cape Verdean (95.1%, a difference of 0.090%), and Immigrants from Belize (95.3%, a difference of 0.10%).
| Demographics | Rating | Rank | 6th Grade |
| Immigrants | Vietnam | 0.0 /100 | #314 | Tragic 95.4% |
| Immigrants | Bangladesh | 0.0 /100 | #315 | Tragic 95.4% |
| Japanese | 0.0 /100 | #316 | Tragic 95.4% |
| Vietnamese | 0.0 /100 | #317 | Tragic 95.3% |
| Belizeans | 0.0 /100 | #318 | Tragic 95.3% |
| Immigrants | Belize | 0.0 /100 | #319 | Tragic 95.3% |
| Immigrants | Ecuador | 0.0 /100 | #320 | Tragic 95.3% |
| Immigrants | Fiji | 0.0 /100 | #321 | Tragic 95.2% |
| Immigrants | Cambodia | 0.0 /100 | #322 | Tragic 95.2% |
| Central American Indians | 0.0 /100 | #323 | Tragic 95.1% |
| Cape Verdeans | 0.0 /100 | #324 | Tragic 95.1% |
| Immigrants | Nicaragua | 0.0 /100 | #325 | Tragic 95.1% |
| Hispanics or Latinos | 0.0 /100 | #326 | Tragic 95.0% |
| Mexican American Indians | 0.0 /100 | #327 | Tragic 95.0% |
| Hondurans | 0.0 /100 | #328 | Tragic 95.0% |