Argentinean vs Bolivian 6th Grade
COMPARE
Argentinean
Bolivian
6th Grade
6th Grade Comparison
Argentineans
Bolivians
97.0%
6TH GRADE
33.0/ 100
METRIC RATING
185th/ 347
METRIC RANK
96.5%
6TH GRADE
1.0/ 100
METRIC RATING
247th/ 347
METRIC RANK
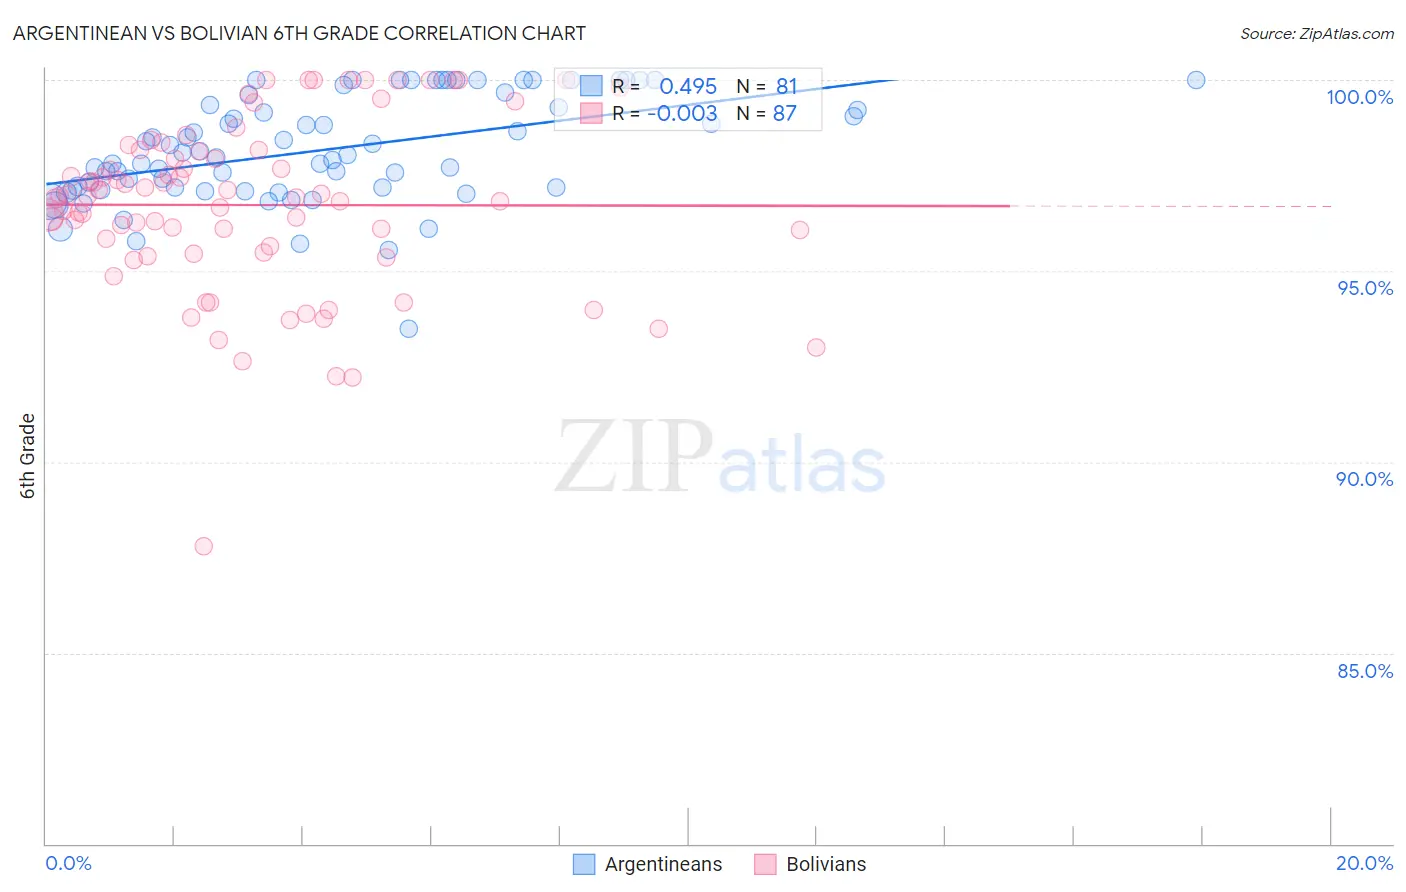
Argentinean vs Bolivian 6th Grade Correlation Chart
The statistical analysis conducted on geographies consisting of 297,143,222 people shows a moderate positive correlation between the proportion of Argentineans and percentage of population with at least 6th grade education in the United States with a correlation coefficient (R) of 0.495 and weighted average of 97.0%. Similarly, the statistical analysis conducted on geographies consisting of 184,666,822 people shows no correlation between the proportion of Bolivians and percentage of population with at least 6th grade education in the United States with a correlation coefficient (R) of -0.003 and weighted average of 96.5%, a difference of 0.45%.
6th Grade Correlation Summary
| Measurement | Argentinean | Bolivian |
| Minimum | 93.5% | 87.8% |
| Maximum | 100.0% | 100.0% |
| Range | 6.5% | 12.2% |
| Mean | 98.2% | 96.7% |
| Median | 98.0% | 96.9% |
| Interquartile 25% (IQ1) | 97.2% | 95.5% |
| Interquartile 75% (IQ3) | 99.5% | 98.2% |
| Interquartile Range (IQR) | 2.3% | 2.7% |
| Standard Deviation (Sample) | 1.4% | 2.3% |
| Standard Deviation (Population) | 1.4% | 2.2% |
Similar Demographics by 6th Grade
Demographics Similar to Argentineans by 6th Grade
In terms of 6th grade, the demographic groups most similar to Argentineans are Spanish American (97.0%, a difference of 0.0%), Immigrants from Ukraine (97.0%, a difference of 0.010%), Immigrants from Venezuela (97.0%, a difference of 0.010%), Immigrants from Egypt (97.0%, a difference of 0.010%), and Guamanian/Chamorro (97.0%, a difference of 0.010%).
| Demographics | Rating | Rank | 6th Grade |
| Pakistanis | 46.0 /100 | #178 | Average 97.0% |
| Immigrants | Kenya | 45.3 /100 | #179 | Average 97.0% |
| Immigrants | Spain | 39.9 /100 | #180 | Fair 97.0% |
| Comanche | 37.9 /100 | #181 | Fair 97.0% |
| Immigrants | Ukraine | 35.6 /100 | #182 | Fair 97.0% |
| Immigrants | Venezuela | 34.5 /100 | #183 | Fair 97.0% |
| Spanish Americans | 33.5 /100 | #184 | Fair 97.0% |
| Argentineans | 33.0 /100 | #185 | Fair 97.0% |
| Immigrants | Egypt | 31.4 /100 | #186 | Fair 97.0% |
| Guamanians/Chamorros | 30.6 /100 | #187 | Fair 97.0% |
| Immigrants | Argentina | 30.4 /100 | #188 | Fair 97.0% |
| Blacks/African Americans | 30.2 /100 | #189 | Fair 97.0% |
| Dutch West Indians | 28.3 /100 | #190 | Fair 96.9% |
| Panamanians | 27.3 /100 | #191 | Fair 96.9% |
| Hawaiians | 27.0 /100 | #192 | Fair 96.9% |
Demographics Similar to Bolivians by 6th Grade
In terms of 6th grade, the demographic groups most similar to Bolivians are Tohono O'odham (96.5%, a difference of 0.0%), Colombian (96.5%, a difference of 0.010%), Immigrants from Costa Rica (96.6%, a difference of 0.030%), Immigrants from Africa (96.6%, a difference of 0.030%), and Immigrants from Middle Africa (96.5%, a difference of 0.030%).
| Demographics | Rating | Rank | 6th Grade |
| Koreans | 1.9 /100 | #240 | Tragic 96.6% |
| Senegalese | 1.8 /100 | #241 | Tragic 96.6% |
| Immigrants | Asia | 1.8 /100 | #242 | Tragic 96.6% |
| Immigrants | Liberia | 1.6 /100 | #243 | Tragic 96.6% |
| Ethiopians | 1.5 /100 | #244 | Tragic 96.6% |
| Immigrants | Costa Rica | 1.3 /100 | #245 | Tragic 96.6% |
| Immigrants | Africa | 1.3 /100 | #246 | Tragic 96.6% |
| Bolivians | 1.0 /100 | #247 | Tragic 96.5% |
| Tohono O'odham | 1.0 /100 | #248 | Tragic 96.5% |
| Colombians | 0.9 /100 | #249 | Tragic 96.5% |
| Immigrants | Middle Africa | 0.8 /100 | #250 | Tragic 96.5% |
| Immigrants | Senegal | 0.7 /100 | #251 | Tragic 96.5% |
| Immigrants | Uruguay | 0.6 /100 | #252 | Tragic 96.5% |
| Jamaicans | 0.6 /100 | #253 | Tragic 96.5% |
| Immigrants | Ethiopia | 0.6 /100 | #254 | Tragic 96.5% |