Pennsylvania German vs Immigrants from Fiji 6th Grade
COMPARE
Pennsylvania German
Immigrants from Fiji
6th Grade
6th Grade Comparison
Pennsylvania Germans
Immigrants from Fiji
98.1%
6TH GRADE
100.0/ 100
METRIC RATING
18th/ 347
METRIC RANK
95.2%
6TH GRADE
0.0/ 100
METRIC RATING
321st/ 347
METRIC RANK
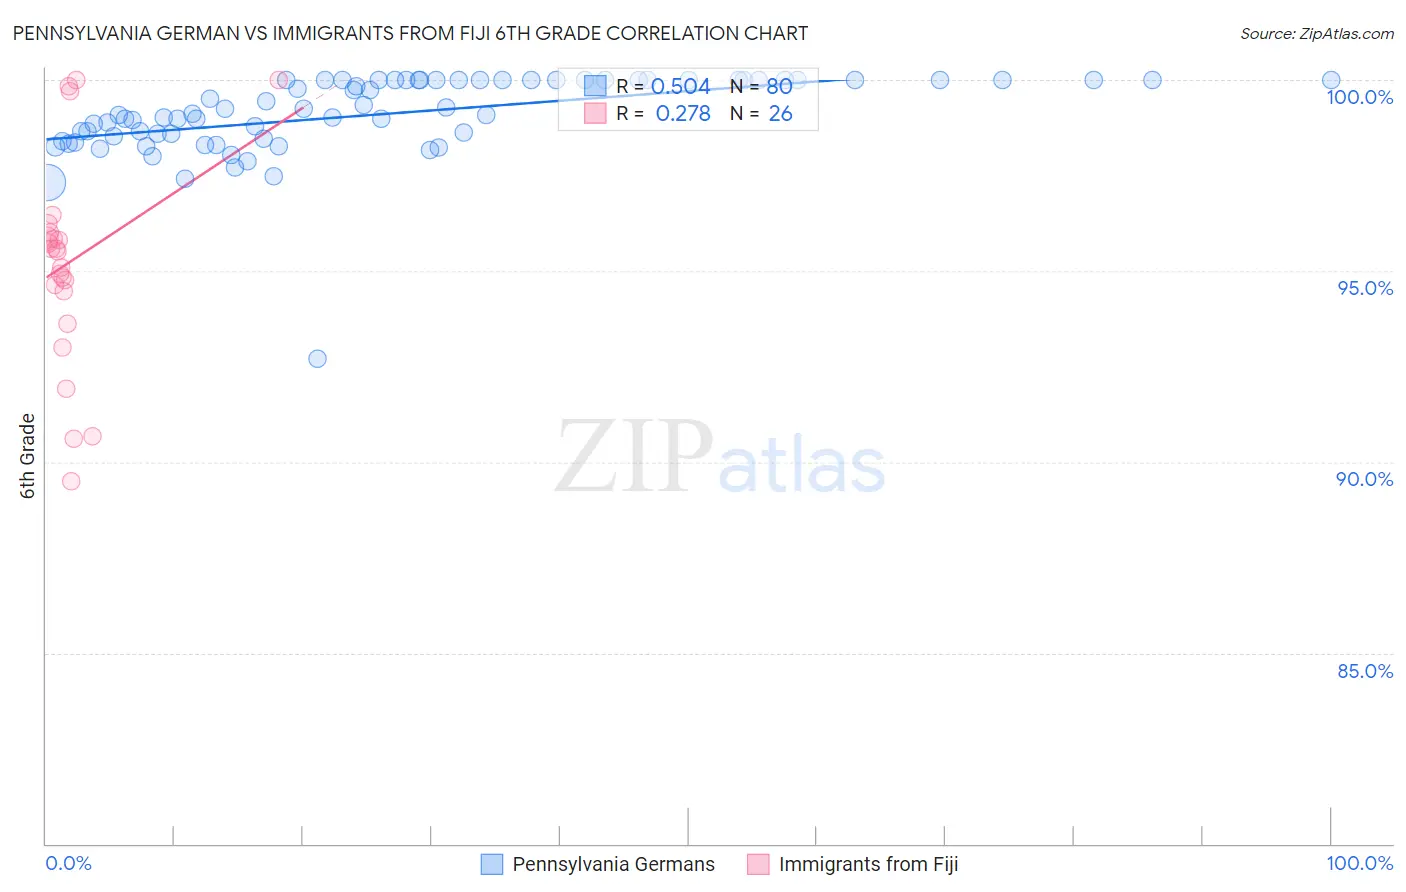
Pennsylvania German vs Immigrants from Fiji 6th Grade Correlation Chart
The statistical analysis conducted on geographies consisting of 234,102,531 people shows a substantial positive correlation between the proportion of Pennsylvania Germans and percentage of population with at least 6th grade education in the United States with a correlation coefficient (R) of 0.504 and weighted average of 98.1%. Similarly, the statistical analysis conducted on geographies consisting of 93,756,204 people shows a weak positive correlation between the proportion of Immigrants from Fiji and percentage of population with at least 6th grade education in the United States with a correlation coefficient (R) of 0.278 and weighted average of 95.2%, a difference of 3.0%.
6th Grade Correlation Summary
| Measurement | Pennsylvania German | Immigrants from Fiji |
| Minimum | 92.7% | 89.5% |
| Maximum | 100.0% | 100.0% |
| Range | 7.3% | 10.5% |
| Mean | 99.1% | 95.2% |
| Median | 99.2% | 95.5% |
| Interquartile 25% (IQ1) | 98.5% | 94.5% |
| Interquartile 75% (IQ3) | 100.0% | 96.0% |
| Interquartile Range (IQR) | 1.5% | 1.6% |
| Standard Deviation (Sample) | 1.1% | 2.7% |
| Standard Deviation (Population) | 1.1% | 2.7% |
Similar Demographics by 6th Grade
Demographics Similar to Pennsylvania Germans by 6th Grade
In terms of 6th grade, the demographic groups most similar to Pennsylvania Germans are Polish (98.1%, a difference of 0.0%), Scottish (98.1%, a difference of 0.010%), Irish (98.1%, a difference of 0.010%), Carpatho Rusyn (98.1%, a difference of 0.020%), and Inupiat (98.1%, a difference of 0.020%).
| Demographics | Rating | Rank | 6th Grade |
| English | 100.0 /100 | #11 | Exceptional 98.1% |
| Alaskan Athabascans | 100.0 /100 | #12 | Exceptional 98.1% |
| Tlingit-Haida | 100.0 /100 | #13 | Exceptional 98.1% |
| Carpatho Rusyns | 100.0 /100 | #14 | Exceptional 98.1% |
| Inupiat | 100.0 /100 | #15 | Exceptional 98.1% |
| Scottish | 100.0 /100 | #16 | Exceptional 98.1% |
| Poles | 100.0 /100 | #17 | Exceptional 98.1% |
| Pennsylvania Germans | 100.0 /100 | #18 | Exceptional 98.1% |
| Irish | 100.0 /100 | #19 | Exceptional 98.1% |
| Finns | 100.0 /100 | #20 | Exceptional 98.1% |
| Lithuanians | 100.0 /100 | #21 | Exceptional 98.1% |
| Danes | 100.0 /100 | #22 | Exceptional 98.0% |
| Sioux | 100.0 /100 | #23 | Exceptional 98.0% |
| Croatians | 100.0 /100 | #24 | Exceptional 98.0% |
| Scotch-Irish | 100.0 /100 | #25 | Exceptional 98.0% |
Demographics Similar to Immigrants from Fiji by 6th Grade
In terms of 6th grade, the demographic groups most similar to Immigrants from Fiji are Immigrants from Cambodia (95.2%, a difference of 0.050%), Immigrants from Ecuador (95.3%, a difference of 0.060%), Central American Indian (95.1%, a difference of 0.060%), Cape Verdean (95.1%, a difference of 0.090%), and Immigrants from Belize (95.3%, a difference of 0.10%).
| Demographics | Rating | Rank | 6th Grade |
| Immigrants | Vietnam | 0.0 /100 | #314 | Tragic 95.4% |
| Immigrants | Bangladesh | 0.0 /100 | #315 | Tragic 95.4% |
| Japanese | 0.0 /100 | #316 | Tragic 95.4% |
| Vietnamese | 0.0 /100 | #317 | Tragic 95.3% |
| Belizeans | 0.0 /100 | #318 | Tragic 95.3% |
| Immigrants | Belize | 0.0 /100 | #319 | Tragic 95.3% |
| Immigrants | Ecuador | 0.0 /100 | #320 | Tragic 95.3% |
| Immigrants | Fiji | 0.0 /100 | #321 | Tragic 95.2% |
| Immigrants | Cambodia | 0.0 /100 | #322 | Tragic 95.2% |
| Central American Indians | 0.0 /100 | #323 | Tragic 95.1% |
| Cape Verdeans | 0.0 /100 | #324 | Tragic 95.1% |
| Immigrants | Nicaragua | 0.0 /100 | #325 | Tragic 95.1% |
| Hispanics or Latinos | 0.0 /100 | #326 | Tragic 95.0% |
| Mexican American Indians | 0.0 /100 | #327 | Tragic 95.0% |
| Hondurans | 0.0 /100 | #328 | Tragic 95.0% |