Argentinean vs Immigrants from Costa Rica 6th Grade
COMPARE
Argentinean
Immigrants from Costa Rica
6th Grade
6th Grade Comparison
Argentineans
Immigrants from Costa Rica
97.0%
6TH GRADE
33.0/ 100
METRIC RATING
185th/ 347
METRIC RANK
96.6%
6TH GRADE
1.3/ 100
METRIC RATING
245th/ 347
METRIC RANK
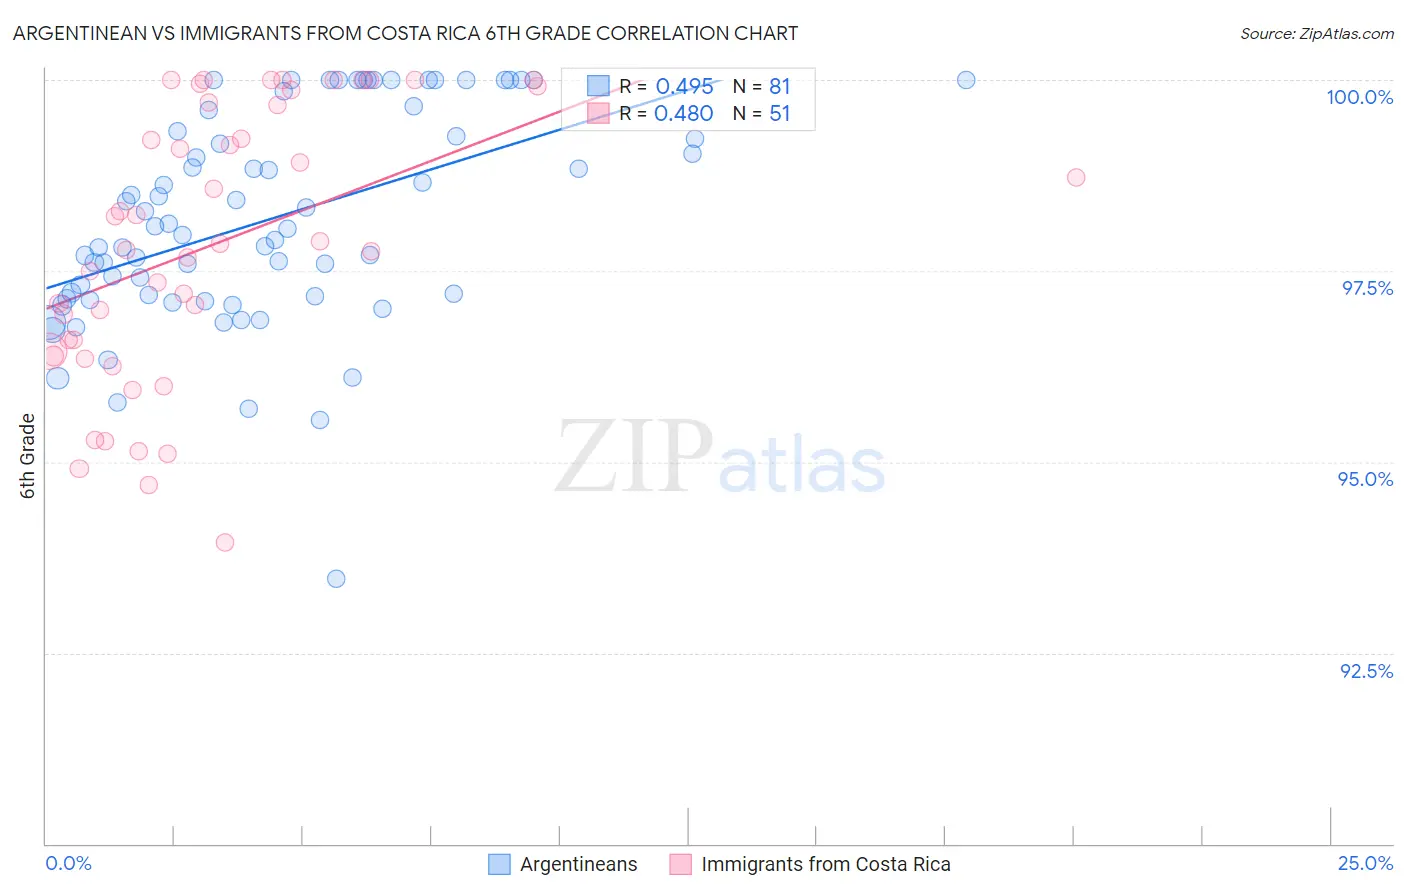
Argentinean vs Immigrants from Costa Rica 6th Grade Correlation Chart
The statistical analysis conducted on geographies consisting of 297,143,222 people shows a moderate positive correlation between the proportion of Argentineans and percentage of population with at least 6th grade education in the United States with a correlation coefficient (R) of 0.495 and weighted average of 97.0%. Similarly, the statistical analysis conducted on geographies consisting of 204,275,869 people shows a moderate positive correlation between the proportion of Immigrants from Costa Rica and percentage of population with at least 6th grade education in the United States with a correlation coefficient (R) of 0.480 and weighted average of 96.6%, a difference of 0.42%.
6th Grade Correlation Summary
| Measurement | Argentinean | Immigrants from Costa Rica |
| Minimum | 93.5% | 93.9% |
| Maximum | 100.0% | 100.0% |
| Range | 6.5% | 6.1% |
| Mean | 98.2% | 97.9% |
| Median | 98.0% | 97.9% |
| Interquartile 25% (IQ1) | 97.2% | 96.4% |
| Interquartile 75% (IQ3) | 99.5% | 99.7% |
| Interquartile Range (IQR) | 2.3% | 3.3% |
| Standard Deviation (Sample) | 1.4% | 1.8% |
| Standard Deviation (Population) | 1.4% | 1.7% |
Similar Demographics by 6th Grade
Demographics Similar to Argentineans by 6th Grade
In terms of 6th grade, the demographic groups most similar to Argentineans are Spanish American (97.0%, a difference of 0.0%), Immigrants from Ukraine (97.0%, a difference of 0.010%), Immigrants from Venezuela (97.0%, a difference of 0.010%), Immigrants from Egypt (97.0%, a difference of 0.010%), and Guamanian/Chamorro (97.0%, a difference of 0.010%).
| Demographics | Rating | Rank | 6th Grade |
| Pakistanis | 46.0 /100 | #178 | Average 97.0% |
| Immigrants | Kenya | 45.3 /100 | #179 | Average 97.0% |
| Immigrants | Spain | 39.9 /100 | #180 | Fair 97.0% |
| Comanche | 37.9 /100 | #181 | Fair 97.0% |
| Immigrants | Ukraine | 35.6 /100 | #182 | Fair 97.0% |
| Immigrants | Venezuela | 34.5 /100 | #183 | Fair 97.0% |
| Spanish Americans | 33.5 /100 | #184 | Fair 97.0% |
| Argentineans | 33.0 /100 | #185 | Fair 97.0% |
| Immigrants | Egypt | 31.4 /100 | #186 | Fair 97.0% |
| Guamanians/Chamorros | 30.6 /100 | #187 | Fair 97.0% |
| Immigrants | Argentina | 30.4 /100 | #188 | Fair 97.0% |
| Blacks/African Americans | 30.2 /100 | #189 | Fair 97.0% |
| Dutch West Indians | 28.3 /100 | #190 | Fair 96.9% |
| Panamanians | 27.3 /100 | #191 | Fair 96.9% |
| Hawaiians | 27.0 /100 | #192 | Fair 96.9% |
Demographics Similar to Immigrants from Costa Rica by 6th Grade
In terms of 6th grade, the demographic groups most similar to Immigrants from Costa Rica are Immigrants from Africa (96.6%, a difference of 0.0%), Ethiopian (96.6%, a difference of 0.020%), Immigrants from Liberia (96.6%, a difference of 0.030%), Bolivian (96.5%, a difference of 0.030%), and Nigerian (96.6%, a difference of 0.040%).
| Demographics | Rating | Rank | 6th Grade |
| Nigerians | 1.9 /100 | #238 | Tragic 96.6% |
| Indians (Asian) | 1.9 /100 | #239 | Tragic 96.6% |
| Koreans | 1.9 /100 | #240 | Tragic 96.6% |
| Senegalese | 1.8 /100 | #241 | Tragic 96.6% |
| Immigrants | Asia | 1.8 /100 | #242 | Tragic 96.6% |
| Immigrants | Liberia | 1.6 /100 | #243 | Tragic 96.6% |
| Ethiopians | 1.5 /100 | #244 | Tragic 96.6% |
| Immigrants | Costa Rica | 1.3 /100 | #245 | Tragic 96.6% |
| Immigrants | Africa | 1.3 /100 | #246 | Tragic 96.6% |
| Bolivians | 1.0 /100 | #247 | Tragic 96.5% |
| Tohono O'odham | 1.0 /100 | #248 | Tragic 96.5% |
| Colombians | 0.9 /100 | #249 | Tragic 96.5% |
| Immigrants | Middle Africa | 0.8 /100 | #250 | Tragic 96.5% |
| Immigrants | Senegal | 0.7 /100 | #251 | Tragic 96.5% |
| Immigrants | Uruguay | 0.6 /100 | #252 | Tragic 96.5% |