Arapaho vs U.S. Virgin Islander No Schooling Completed
COMPARE
Arapaho
U.S. Virgin Islander
No Schooling Completed
No Schooling Completed Comparison
Arapaho
U.S. Virgin Islanders
2.1%
NO SCHOOLING COMPLETED
45.0/ 100
METRIC RATING
177th/ 347
METRIC RANK
2.3%
NO SCHOOLING COMPLETED
3.7/ 100
METRIC RATING
228th/ 347
METRIC RANK
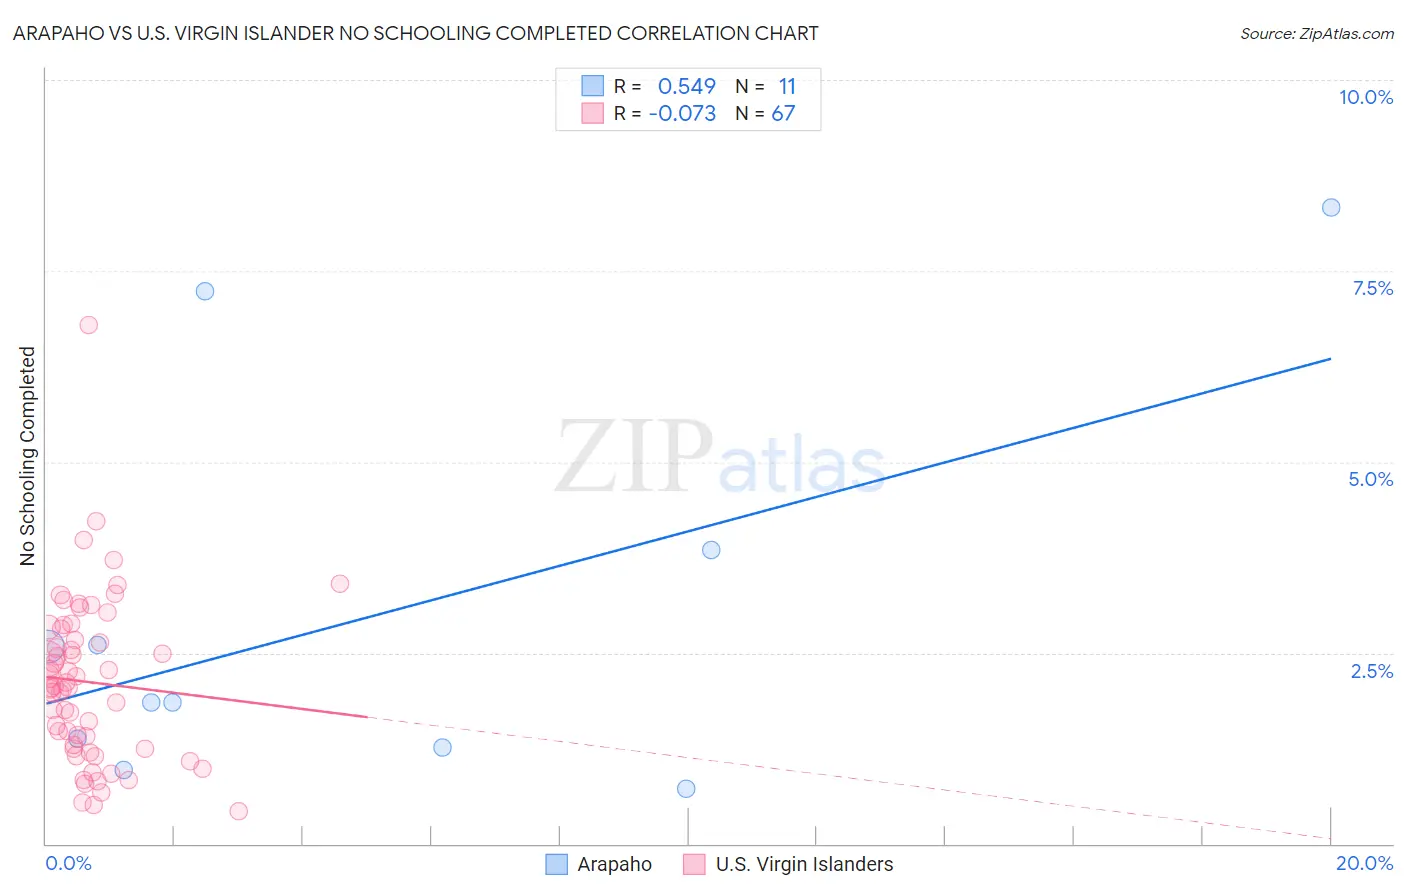
Arapaho vs U.S. Virgin Islander No Schooling Completed Correlation Chart
The statistical analysis conducted on geographies consisting of 29,619,913 people shows a substantial positive correlation between the proportion of Arapaho and percentage of population with no schooling in the United States with a correlation coefficient (R) of 0.549 and weighted average of 2.1%. Similarly, the statistical analysis conducted on geographies consisting of 87,394,001 people shows a slight negative correlation between the proportion of U.S. Virgin Islanders and percentage of population with no schooling in the United States with a correlation coefficient (R) of -0.073 and weighted average of 2.3%, a difference of 10.2%.
No Schooling Completed Correlation Summary
| Measurement | Arapaho | U.S. Virgin Islander |
| Minimum | 0.72% | 0.43% |
| Maximum | 8.3% | 6.8% |
| Range | 7.6% | 6.4% |
| Mean | 3.0% | 2.1% |
| Median | 1.9% | 2.0% |
| Interquartile 25% (IQ1) | 1.3% | 1.2% |
| Interquartile 75% (IQ3) | 3.8% | 2.8% |
| Interquartile Range (IQR) | 2.6% | 1.6% |
| Standard Deviation (Sample) | 2.5% | 1.1% |
| Standard Deviation (Population) | 2.4% | 1.1% |
Similar Demographics by No Schooling Completed
Demographics Similar to Arapaho by No Schooling Completed
In terms of no schooling completed, the demographic groups most similar to Arapaho are Panamanian (2.1%, a difference of 0.020%), Pakistani (2.1%, a difference of 0.040%), Immigrants from Kazakhstan (2.1%, a difference of 0.10%), Portuguese (2.1%, a difference of 0.16%), and Arab (2.1%, a difference of 0.19%).
| Demographics | Rating | Rank | No Schooling Completed |
| Argentineans | 56.0 /100 | #170 | Average 2.1% |
| Immigrants | Poland | 55.2 /100 | #171 | Average 2.1% |
| Immigrants | Argentina | 52.7 /100 | #172 | Average 2.1% |
| Immigrants | Belarus | 51.8 /100 | #173 | Average 2.1% |
| Immigrants | Micronesia | 50.0 /100 | #174 | Average 2.1% |
| Arabs | 46.4 /100 | #175 | Average 2.1% |
| Panamanians | 45.2 /100 | #176 | Average 2.1% |
| Arapaho | 45.0 /100 | #177 | Average 2.1% |
| Pakistanis | 44.7 /100 | #178 | Average 2.1% |
| Immigrants | Kazakhstan | 44.3 /100 | #179 | Average 2.1% |
| Portuguese | 43.9 /100 | #180 | Average 2.1% |
| Immigrants | Taiwan | 42.6 /100 | #181 | Average 2.1% |
| French American Indians | 42.2 /100 | #182 | Average 2.1% |
| Blacks/African Americans | 41.4 /100 | #183 | Average 2.1% |
| Pima | 41.3 /100 | #184 | Average 2.1% |
Demographics Similar to U.S. Virgin Islanders by No Schooling Completed
In terms of no schooling completed, the demographic groups most similar to U.S. Virgin Islanders are Immigrants from Pakistan (2.3%, a difference of 0.080%), Puerto Rican (2.3%, a difference of 0.22%), Immigrants from Uruguay (2.3%, a difference of 0.24%), Immigrants from Uganda (2.3%, a difference of 0.29%), and Sierra Leonean (2.3%, a difference of 0.34%).
| Demographics | Rating | Rank | No Schooling Completed |
| Immigrants | Sudan | 5.0 /100 | #221 | Tragic 2.3% |
| Sub-Saharan Africans | 4.7 /100 | #222 | Tragic 2.3% |
| Immigrants | Lebanon | 4.5 /100 | #223 | Tragic 2.3% |
| Tohono O'odham | 4.1 /100 | #224 | Tragic 2.3% |
| Sudanese | 4.1 /100 | #225 | Tragic 2.3% |
| Sierra Leoneans | 4.1 /100 | #226 | Tragic 2.3% |
| Immigrants | Uganda | 4.0 /100 | #227 | Tragic 2.3% |
| U.S. Virgin Islanders | 3.7 /100 | #228 | Tragic 2.3% |
| Immigrants | Pakistan | 3.6 /100 | #229 | Tragic 2.3% |
| Puerto Ricans | 3.4 /100 | #230 | Tragic 2.3% |
| Immigrants | Uruguay | 3.4 /100 | #231 | Tragic 2.3% |
| Colombians | 3.2 /100 | #232 | Tragic 2.3% |
| Immigrants | Malaysia | 2.8 /100 | #233 | Tragic 2.3% |
| Nigerians | 2.6 /100 | #234 | Tragic 2.3% |
| Immigrants | Western Asia | 2.6 /100 | #235 | Tragic 2.3% |