Arapaho vs Immigrants from Bosnia and Herzegovina No Schooling Completed
COMPARE
Arapaho
Immigrants from Bosnia and Herzegovina
No Schooling Completed
No Schooling Completed Comparison
Arapaho
Immigrants from Bosnia and Herzegovina
2.1%
NO SCHOOLING COMPLETED
45.0/ 100
METRIC RATING
177th/ 347
METRIC RANK
2.1%
NO SCHOOLING COMPLETED
38.6/ 100
METRIC RATING
186th/ 347
METRIC RANK
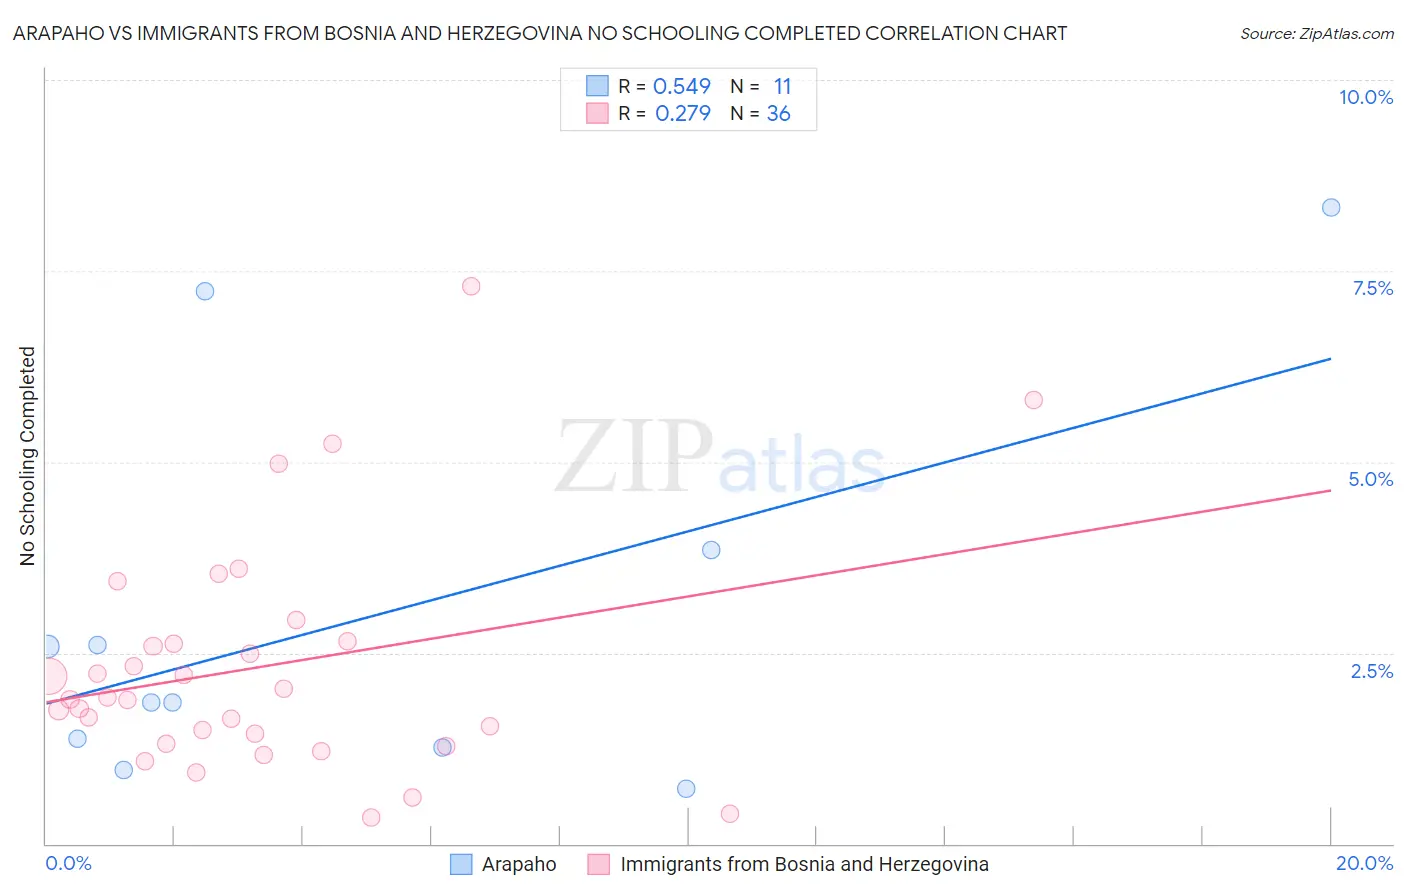
Arapaho vs Immigrants from Bosnia and Herzegovina No Schooling Completed Correlation Chart
The statistical analysis conducted on geographies consisting of 29,619,913 people shows a substantial positive correlation between the proportion of Arapaho and percentage of population with no schooling in the United States with a correlation coefficient (R) of 0.549 and weighted average of 2.1%. Similarly, the statistical analysis conducted on geographies consisting of 156,377,328 people shows a weak positive correlation between the proportion of Immigrants from Bosnia and Herzegovina and percentage of population with no schooling in the United States with a correlation coefficient (R) of 0.279 and weighted average of 2.1%, a difference of 0.88%.
No Schooling Completed Correlation Summary
| Measurement | Arapaho | Immigrants from Bosnia and Herzegovina |
| Minimum | 0.72% | 0.34% |
| Maximum | 8.3% | 7.3% |
| Range | 7.6% | 7.0% |
| Mean | 3.0% | 2.3% |
| Median | 1.9% | 1.9% |
| Interquartile 25% (IQ1) | 1.3% | 1.4% |
| Interquartile 75% (IQ3) | 3.8% | 2.6% |
| Interquartile Range (IQR) | 2.6% | 1.3% |
| Standard Deviation (Sample) | 2.5% | 1.5% |
| Standard Deviation (Population) | 2.4% | 1.5% |
Demographics Similar to Arapaho and Immigrants from Bosnia and Herzegovina by No Schooling Completed
In terms of no schooling completed, the demographic groups most similar to Arapaho are Panamanian (2.1%, a difference of 0.020%), Pakistani (2.1%, a difference of 0.040%), Immigrants from Kazakhstan (2.1%, a difference of 0.10%), Portuguese (2.1%, a difference of 0.16%), and Arab (2.1%, a difference of 0.19%). Similarly, the demographic groups most similar to Immigrants from Bosnia and Herzegovina are Mongolian (2.1%, a difference of 0.30%), Navajo (2.1%, a difference of 0.30%), Immigrants from Kenya (2.1%, a difference of 0.35%), Immigrants from Egypt (2.1%, a difference of 0.36%), and Pima (2.1%, a difference of 0.37%).
| Demographics | Rating | Rank | No Schooling Completed |
| Immigrants | Poland | 55.2 /100 | #171 | Average 2.1% |
| Immigrants | Argentina | 52.7 /100 | #172 | Average 2.1% |
| Immigrants | Belarus | 51.8 /100 | #173 | Average 2.1% |
| Immigrants | Micronesia | 50.0 /100 | #174 | Average 2.1% |
| Arabs | 46.4 /100 | #175 | Average 2.1% |
| Panamanians | 45.2 /100 | #176 | Average 2.1% |
| Arapaho | 45.0 /100 | #177 | Average 2.1% |
| Pakistanis | 44.7 /100 | #178 | Average 2.1% |
| Immigrants | Kazakhstan | 44.3 /100 | #179 | Average 2.1% |
| Portuguese | 43.9 /100 | #180 | Average 2.1% |
| Immigrants | Taiwan | 42.6 /100 | #181 | Average 2.1% |
| French American Indians | 42.2 /100 | #182 | Average 2.1% |
| Blacks/African Americans | 41.4 /100 | #183 | Average 2.1% |
| Pima | 41.3 /100 | #184 | Average 2.1% |
| Mongolians | 40.8 /100 | #185 | Average 2.1% |
| Immigrants | Bosnia and Herzegovina | 38.6 /100 | #186 | Fair 2.1% |
| Navajo | 36.5 /100 | #187 | Fair 2.1% |
| Immigrants | Kenya | 36.2 /100 | #188 | Fair 2.1% |
| Immigrants | Egypt | 36.1 /100 | #189 | Fair 2.1% |
| Spanish Americans | 32.6 /100 | #190 | Fair 2.1% |
| Bermudans | 30.7 /100 | #191 | Fair 2.1% |