Arab vs South American 3rd Grade
COMPARE
Arab
South American
3rd Grade
3rd Grade Comparison
Arabs
South Americans
97.7%
3RD GRADE
40.0/ 100
METRIC RATING
183rd/ 347
METRIC RANK
97.4%
3RD GRADE
0.9/ 100
METRIC RATING
249th/ 347
METRIC RANK
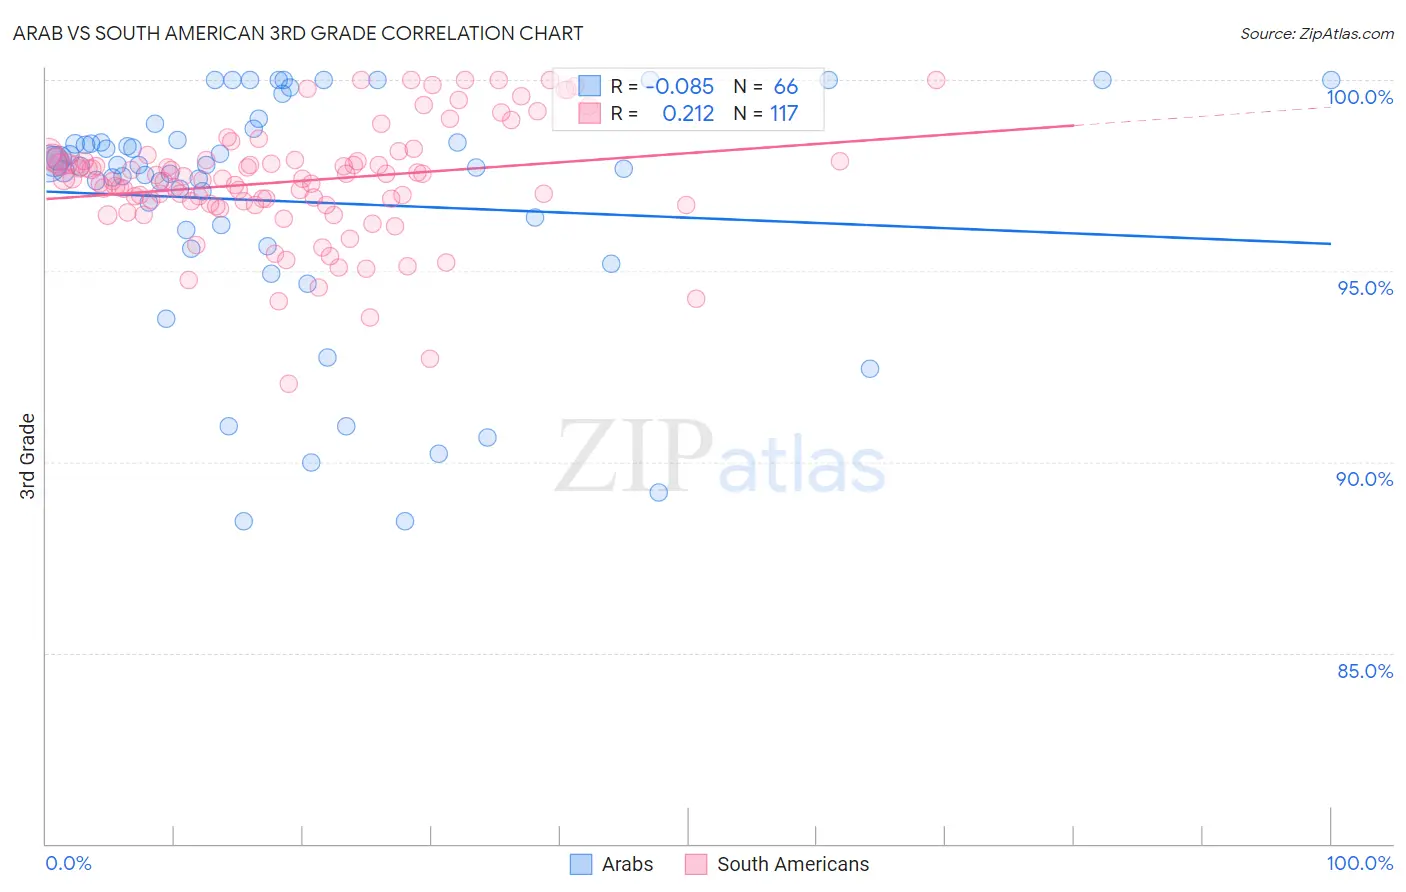
Arab vs South American 3rd Grade Correlation Chart
The statistical analysis conducted on geographies consisting of 486,872,222 people shows a slight negative correlation between the proportion of Arabs and percentage of population with at least 3rd grade education in the United States with a correlation coefficient (R) of -0.085 and weighted average of 97.7%. Similarly, the statistical analysis conducted on geographies consisting of 494,178,447 people shows a weak positive correlation between the proportion of South Americans and percentage of population with at least 3rd grade education in the United States with a correlation coefficient (R) of 0.212 and weighted average of 97.4%, a difference of 0.36%.
3rd Grade Correlation Summary
| Measurement | Arab | South American |
| Minimum | 88.4% | 92.1% |
| Maximum | 100.0% | 100.0% |
| Range | 11.6% | 7.9% |
| Mean | 96.8% | 97.3% |
| Median | 97.8% | 97.4% |
| Interquartile 25% (IQ1) | 96.1% | 96.8% |
| Interquartile 75% (IQ3) | 98.4% | 97.9% |
| Interquartile Range (IQR) | 2.4% | 1.2% |
| Standard Deviation (Sample) | 3.1% | 1.5% |
| Standard Deviation (Population) | 3.1% | 1.5% |
Similar Demographics by 3rd Grade
Demographics Similar to Arabs by 3rd Grade
In terms of 3rd grade, the demographic groups most similar to Arabs are Argentinean (97.7%, a difference of 0.010%), Immigrants from Kazakhstan (97.7%, a difference of 0.010%), Immigrants from Argentina (97.7%, a difference of 0.010%), Portuguese (97.7%, a difference of 0.010%), and Immigrants from Poland (97.8%, a difference of 0.020%).
| Demographics | Rating | Rank | 3rd Grade |
| Immigrants | Poland | 47.1 /100 | #176 | Average 97.8% |
| Egyptians | 46.6 /100 | #177 | Average 97.7% |
| Immigrants | Brazil | 46.4 /100 | #178 | Average 97.7% |
| Immigrants | Belarus | 45.9 /100 | #179 | Average 97.7% |
| Immigrants | Sri Lanka | 45.1 /100 | #180 | Average 97.7% |
| Immigrants | Venezuela | 44.4 /100 | #181 | Average 97.7% |
| Argentineans | 42.9 /100 | #182 | Average 97.7% |
| Arabs | 40.0 /100 | #183 | Fair 97.7% |
| Immigrants | Kazakhstan | 37.4 /100 | #184 | Fair 97.7% |
| Immigrants | Argentina | 37.0 /100 | #185 | Fair 97.7% |
| Portuguese | 36.2 /100 | #186 | Fair 97.7% |
| Natives/Alaskans | 35.2 /100 | #187 | Fair 97.7% |
| Immigrants | Taiwan | 34.2 /100 | #188 | Fair 97.7% |
| Pakistanis | 34.2 /100 | #189 | Fair 97.7% |
| Panamanians | 31.5 /100 | #190 | Fair 97.7% |
Demographics Similar to South Americans by 3rd Grade
In terms of 3rd grade, the demographic groups most similar to South Americans are Immigrants from Eastern Africa (97.4%, a difference of 0.0%), Immigrants from Senegal (97.4%, a difference of 0.010%), Assyrian/Chaldean/Syriac (97.4%, a difference of 0.010%), Immigrants from Middle Africa (97.4%, a difference of 0.010%), and Immigrants from Asia (97.4%, a difference of 0.010%).
| Demographics | Rating | Rank | 3rd Grade |
| Koreans | 1.3 /100 | #242 | Tragic 97.4% |
| Indians (Asian) | 1.3 /100 | #243 | Tragic 97.4% |
| Asians | 1.1 /100 | #244 | Tragic 97.4% |
| Ethiopians | 1.1 /100 | #245 | Tragic 97.4% |
| Immigrants | Senegal | 1.0 /100 | #246 | Tragic 97.4% |
| Assyrians/Chaldeans/Syriacs | 1.0 /100 | #247 | Tragic 97.4% |
| Immigrants | Eastern Africa | 0.9 /100 | #248 | Tragic 97.4% |
| South Americans | 0.9 /100 | #249 | Tragic 97.4% |
| Immigrants | Middle Africa | 0.9 /100 | #250 | Tragic 97.4% |
| Immigrants | Asia | 0.8 /100 | #251 | Tragic 97.4% |
| Peruvians | 0.8 /100 | #252 | Tragic 97.4% |
| Immigrants | Africa | 0.8 /100 | #253 | Tragic 97.4% |
| Jamaicans | 0.7 /100 | #254 | Tragic 97.4% |
| Bolivians | 0.6 /100 | #255 | Tragic 97.3% |
| Immigrants | Congo | 0.6 /100 | #256 | Tragic 97.3% |