Arab vs Sioux 3rd Grade
COMPARE
Arab
Sioux
3rd Grade
3rd Grade Comparison
Arabs
Sioux
97.7%
3RD GRADE
40.0/ 100
METRIC RATING
183rd/ 347
METRIC RANK
98.5%
3RD GRADE
100.0/ 100
METRIC RATING
23rd/ 347
METRIC RANK
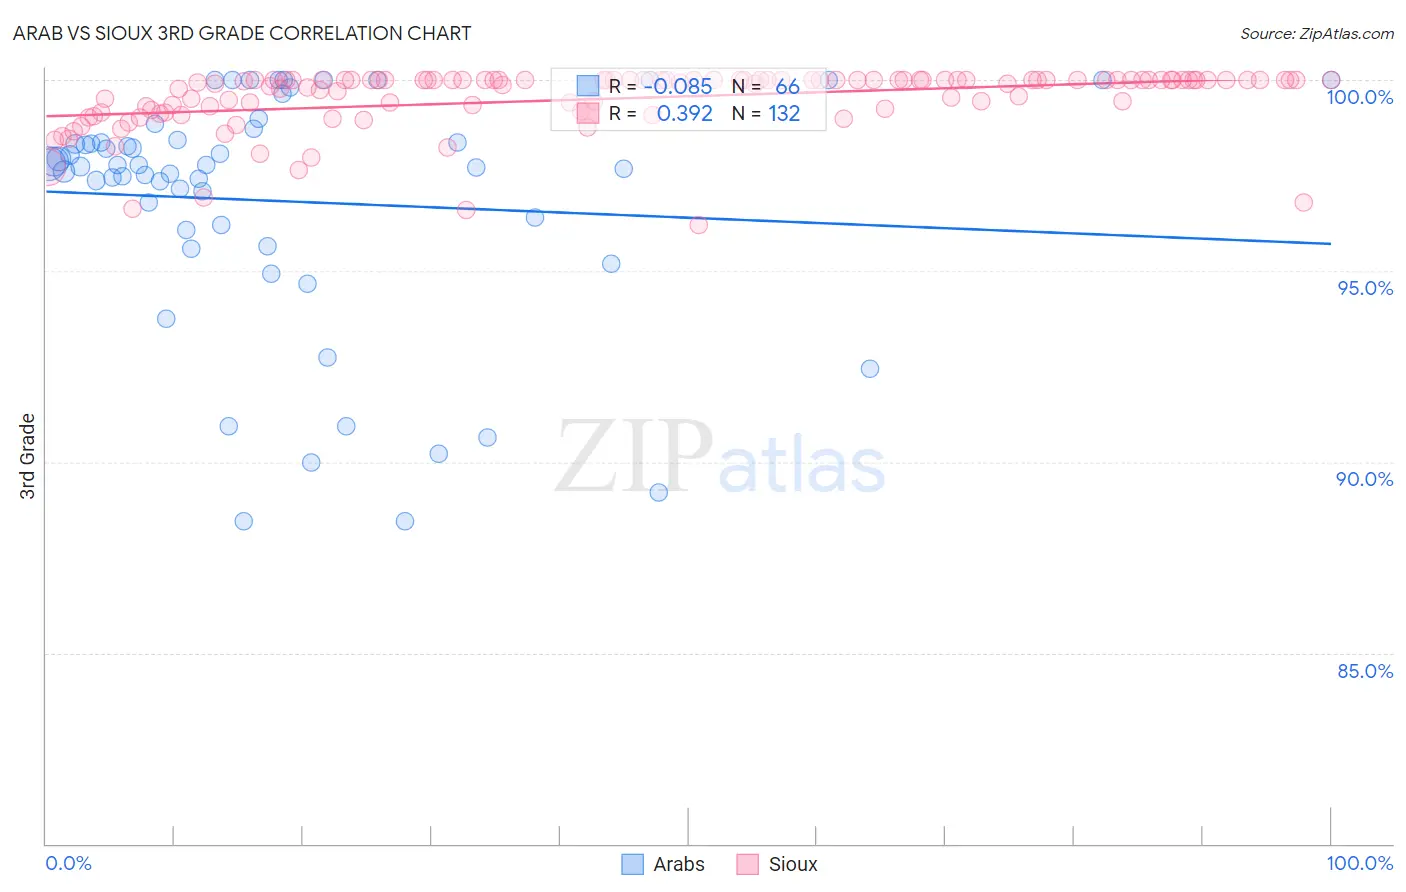
Arab vs Sioux 3rd Grade Correlation Chart
The statistical analysis conducted on geographies consisting of 486,872,222 people shows a slight negative correlation between the proportion of Arabs and percentage of population with at least 3rd grade education in the United States with a correlation coefficient (R) of -0.085 and weighted average of 97.7%. Similarly, the statistical analysis conducted on geographies consisting of 234,197,392 people shows a mild positive correlation between the proportion of Sioux and percentage of population with at least 3rd grade education in the United States with a correlation coefficient (R) of 0.392 and weighted average of 98.5%, a difference of 0.77%.
3rd Grade Correlation Summary
| Measurement | Arab | Sioux |
| Minimum | 88.4% | 96.2% |
| Maximum | 100.0% | 100.0% |
| Range | 11.6% | 3.8% |
| Mean | 96.8% | 99.5% |
| Median | 97.8% | 100.0% |
| Interquartile 25% (IQ1) | 96.1% | 99.2% |
| Interquartile 75% (IQ3) | 98.4% | 100.0% |
| Interquartile Range (IQR) | 2.4% | 0.80% |
| Standard Deviation (Sample) | 3.1% | 0.80% |
| Standard Deviation (Population) | 3.1% | 0.80% |
Similar Demographics by 3rd Grade
Demographics Similar to Arabs by 3rd Grade
In terms of 3rd grade, the demographic groups most similar to Arabs are Argentinean (97.7%, a difference of 0.010%), Immigrants from Kazakhstan (97.7%, a difference of 0.010%), Immigrants from Argentina (97.7%, a difference of 0.010%), Portuguese (97.7%, a difference of 0.010%), and Immigrants from Poland (97.8%, a difference of 0.020%).
| Demographics | Rating | Rank | 3rd Grade |
| Immigrants | Poland | 47.1 /100 | #176 | Average 97.8% |
| Egyptians | 46.6 /100 | #177 | Average 97.7% |
| Immigrants | Brazil | 46.4 /100 | #178 | Average 97.7% |
| Immigrants | Belarus | 45.9 /100 | #179 | Average 97.7% |
| Immigrants | Sri Lanka | 45.1 /100 | #180 | Average 97.7% |
| Immigrants | Venezuela | 44.4 /100 | #181 | Average 97.7% |
| Argentineans | 42.9 /100 | #182 | Average 97.7% |
| Arabs | 40.0 /100 | #183 | Fair 97.7% |
| Immigrants | Kazakhstan | 37.4 /100 | #184 | Fair 97.7% |
| Immigrants | Argentina | 37.0 /100 | #185 | Fair 97.7% |
| Portuguese | 36.2 /100 | #186 | Fair 97.7% |
| Natives/Alaskans | 35.2 /100 | #187 | Fair 97.7% |
| Immigrants | Taiwan | 34.2 /100 | #188 | Fair 97.7% |
| Pakistanis | 34.2 /100 | #189 | Fair 97.7% |
| Panamanians | 31.5 /100 | #190 | Fair 97.7% |
Demographics Similar to Sioux by 3rd Grade
In terms of 3rd grade, the demographic groups most similar to Sioux are Lithuanian (98.5%, a difference of 0.0%), Finnish (98.5%, a difference of 0.0%), Polish (98.5%, a difference of 0.010%), Pennsylvania German (98.5%, a difference of 0.010%), and Danish (98.5%, a difference of 0.010%).
| Demographics | Rating | Rank | 3rd Grade |
| Scottish | 100.0 /100 | #16 | Exceptional 98.5% |
| Dutch | 100.0 /100 | #17 | Exceptional 98.5% |
| Irish | 100.0 /100 | #18 | Exceptional 98.5% |
| Poles | 100.0 /100 | #19 | Exceptional 98.5% |
| Pennsylvania Germans | 100.0 /100 | #20 | Exceptional 98.5% |
| Lithuanians | 100.0 /100 | #21 | Exceptional 98.5% |
| Finns | 100.0 /100 | #22 | Exceptional 98.5% |
| Sioux | 100.0 /100 | #23 | Exceptional 98.5% |
| Danes | 100.0 /100 | #24 | Exceptional 98.5% |
| Scotch-Irish | 100.0 /100 | #25 | Exceptional 98.5% |
| Aleuts | 100.0 /100 | #26 | Exceptional 98.5% |
| Croatians | 100.0 /100 | #27 | Exceptional 98.5% |
| French | 100.0 /100 | #28 | Exceptional 98.4% |
| French Canadians | 100.0 /100 | #29 | Exceptional 98.4% |
| Europeans | 100.0 /100 | #30 | Exceptional 98.4% |