Arab vs Immigrants from Belgium 3rd Grade
COMPARE
Arab
Immigrants from Belgium
3rd Grade
3rd Grade Comparison
Arabs
Immigrants from Belgium
97.7%
3RD GRADE
40.0/ 100
METRIC RATING
183rd/ 347
METRIC RANK
98.1%
3RD GRADE
99.1/ 100
METRIC RATING
79th/ 347
METRIC RANK
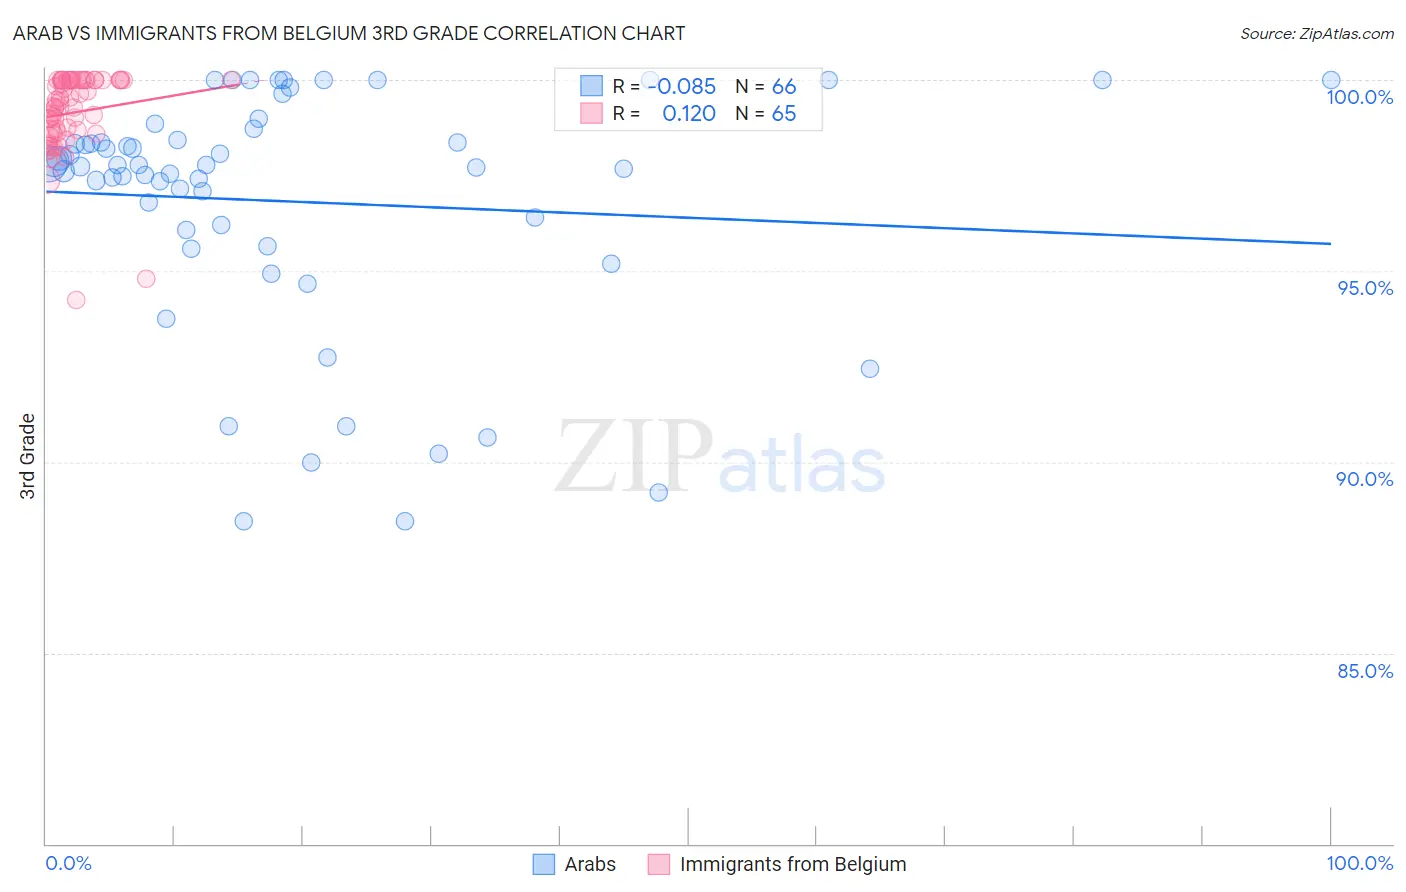
Arab vs Immigrants from Belgium 3rd Grade Correlation Chart
The statistical analysis conducted on geographies consisting of 486,872,222 people shows a slight negative correlation between the proportion of Arabs and percentage of population with at least 3rd grade education in the United States with a correlation coefficient (R) of -0.085 and weighted average of 97.7%. Similarly, the statistical analysis conducted on geographies consisting of 146,727,969 people shows a poor positive correlation between the proportion of Immigrants from Belgium and percentage of population with at least 3rd grade education in the United States with a correlation coefficient (R) of 0.120 and weighted average of 98.1%, a difference of 0.43%.
3rd Grade Correlation Summary
| Measurement | Arab | Immigrants from Belgium |
| Minimum | 88.4% | 94.2% |
| Maximum | 100.0% | 100.0% |
| Range | 11.6% | 5.8% |
| Mean | 96.8% | 99.1% |
| Median | 97.8% | 99.3% |
| Interquartile 25% (IQ1) | 96.1% | 98.6% |
| Interquartile 75% (IQ3) | 98.4% | 100.0% |
| Interquartile Range (IQR) | 2.4% | 1.4% |
| Standard Deviation (Sample) | 3.1% | 1.1% |
| Standard Deviation (Population) | 3.1% | 1.1% |
Similar Demographics by 3rd Grade
Demographics Similar to Arabs by 3rd Grade
In terms of 3rd grade, the demographic groups most similar to Arabs are Argentinean (97.7%, a difference of 0.010%), Immigrants from Kazakhstan (97.7%, a difference of 0.010%), Immigrants from Argentina (97.7%, a difference of 0.010%), Portuguese (97.7%, a difference of 0.010%), and Immigrants from Poland (97.8%, a difference of 0.020%).
| Demographics | Rating | Rank | 3rd Grade |
| Immigrants | Poland | 47.1 /100 | #176 | Average 97.8% |
| Egyptians | 46.6 /100 | #177 | Average 97.7% |
| Immigrants | Brazil | 46.4 /100 | #178 | Average 97.7% |
| Immigrants | Belarus | 45.9 /100 | #179 | Average 97.7% |
| Immigrants | Sri Lanka | 45.1 /100 | #180 | Average 97.7% |
| Immigrants | Venezuela | 44.4 /100 | #181 | Average 97.7% |
| Argentineans | 42.9 /100 | #182 | Average 97.7% |
| Arabs | 40.0 /100 | #183 | Fair 97.7% |
| Immigrants | Kazakhstan | 37.4 /100 | #184 | Fair 97.7% |
| Immigrants | Argentina | 37.0 /100 | #185 | Fair 97.7% |
| Portuguese | 36.2 /100 | #186 | Fair 97.7% |
| Natives/Alaskans | 35.2 /100 | #187 | Fair 97.7% |
| Immigrants | Taiwan | 34.2 /100 | #188 | Fair 97.7% |
| Pakistanis | 34.2 /100 | #189 | Fair 97.7% |
| Panamanians | 31.5 /100 | #190 | Fair 97.7% |
Demographics Similar to Immigrants from Belgium by 3rd Grade
In terms of 3rd grade, the demographic groups most similar to Immigrants from Belgium are Macedonian (98.1%, a difference of 0.0%), Icelander (98.1%, a difference of 0.0%), Immigrants from Lithuania (98.2%, a difference of 0.010%), Osage (98.2%, a difference of 0.010%), and Shoshone (98.1%, a difference of 0.010%).
| Demographics | Rating | Rank | 3rd Grade |
| Chickasaw | 99.5 /100 | #72 | Exceptional 98.2% |
| Cheyenne | 99.3 /100 | #73 | Exceptional 98.2% |
| Immigrants | Netherlands | 99.3 /100 | #74 | Exceptional 98.2% |
| Cherokee | 99.3 /100 | #75 | Exceptional 98.2% |
| Immigrants | England | 99.2 /100 | #76 | Exceptional 98.2% |
| Immigrants | Lithuania | 99.2 /100 | #77 | Exceptional 98.2% |
| Osage | 99.2 /100 | #78 | Exceptional 98.2% |
| Immigrants | Belgium | 99.1 /100 | #79 | Exceptional 98.1% |
| Macedonians | 99.1 /100 | #80 | Exceptional 98.1% |
| Icelanders | 99.1 /100 | #81 | Exceptional 98.1% |
| Shoshone | 99.0 /100 | #82 | Exceptional 98.1% |
| Ukrainians | 98.9 /100 | #83 | Exceptional 98.1% |
| Immigrants | Sweden | 98.9 /100 | #84 | Exceptional 98.1% |
| Immigrants | Australia | 98.9 /100 | #85 | Exceptional 98.1% |
| Potawatomi | 98.9 /100 | #86 | Exceptional 98.1% |