Arab vs Immigrants from Peru 3rd Grade

COMPARE

Arab
Race
Ancestry
AfghanAfricanAlaska NativeAlaskan AthabascanAlbanianAleutAlsatianAmericanApacheArabArapahoArgentineanArmenianAssyrian/Chaldean/SyriacAustralianAustrianBahamianBangladeshiBarbadianBasqueBelgianBelizeanBermudanBhutaneseBlackfeetBolivianBrazilianBritishBritish West IndianBulgarianBurmeseCajunCambodianCanadianCape VerdeanCarpatho RusynCelticCentral AmericanCentral American IndianCherokeeCheyenneChickasawChileanChineseChippewaChoctawColombianColvilleComancheCosta RicanCreeCreekCroatianCrowCubanCypriotCzechCzechoslovakianDanishDelawareDominicanDutchDutch West IndianEastern EuropeanEcuadorianEgyptianEnglishEstonianEthiopianEuropeanFijianFilipinoFinnishFrenchFrench American IndianFrench CanadianGermanGerman RussianGhanaianGreekGuamanian/ChamorroGuatemalanGuyaneseHaitianHmongHonduranHopiHoumaHungarianIcelanderIndian (Asian)IndonesianInupiatIranianIraqiIrishIroquoisIsraeliItalianJamaicanJapaneseJordanianKenyanKiowaKoreanLaotianLatvianLebaneseLiberianLithuanianLumbeeLuxembourgerMacedonianMalaysianMalteseMarshalleseMenomineeMexicanMexican American IndianMongolianMoroccanNative HawaiianNavajoNepaleseNew ZealanderNicaraguanNigerianNorthern EuropeanNorwegianOkinawanOsageOttawaPaiutePakistaniPalestinianPanamanianParaguayanPennsylvania GermanPeruvianPimaPolishPortuguesePotawatomiPuebloPuerto RicanPuget Sound SalishRomanianRussianSalvadoranSamoanScandinavianScotch-IrishScottishSeminoleSenegaleseSerbianShoshoneSierra LeoneanSiouxSlavicSlovakSloveneSomaliSouth AfricanSouth AmericanSouth American IndianSoviet UnionSpaniardSpanishSpanish AmericanSpanish American IndianSri LankanSubsaharan AfricanSudaneseSwedishSwissSyrianTaiwaneseThaiTlingit-HaidaTohono O'OdhamTonganTrinidadian and TobagonianTsimshianTurkishU.S. Virgin IslanderUgandanUkrainianUruguayanUteVenezuelanVietnameseWelshWest IndianYakamaYaquiYugoslavianYumanYup'ikZimbabwean
Immigration
NonimmigrantsImmigrantsAfghanistanAfricaAlbaniaArgentinaArmeniaAsiaAustraliaAustriaBahamasBangladeshBarbadosBelarusBelgiumBelizeBoliviaBosnia and HerzegovinaBrazilBulgariaBurma/MyanmarCabo VerdeCambodiaCameroonCanadaCaribbeanCentral AmericaChileChinaColombiaCongoCosta RicaCroatiaCubaCzechoslovakiaDenmarkDominicaDominican RepublicEastern AfricaEastern AsiaEastern EuropeEcuadorEgyptEl SalvadorEnglandEritreaEthiopiaEuropeFijiFranceGermanyGhanaGreeceGrenadaGuatemalaGuyanaHaitiHondurasHong KongHungaryIndiaIndonesiaIranIraqIrelandIsraelItalyJamaicaJapanJordanKazakhstanKenyaKoreaKuwaitLaosLatin AmericaLatviaLebanonLiberiaLithuaniaMalaysiaMexicoMicronesiaMiddle AfricaMoldovaMoroccoNepalNetherlandsNicaraguaNigeriaNorth AmericaNorth MacedoniaNorthern AfricaNorthern EuropeNorwayOceaniaPakistanPanamaPhilippinesPolandPortugalRomaniaRussiaSaudi ArabiaScotlandSenegalSerbiaSierra LeoneSingaporeSomaliaSouth AfricaSouth AmericaSouth Central AsiaSouth Eastern AsiaSouthern EuropeSpainSri LankaSt. Vincent and the GrenadinesSudanSwedenSwitzerlandSyriaTaiwanThailandTrinidad and TobagoTurkeyUgandaUkraineUruguayUzbekistanVenezuelaVietnamWest IndiesWestern AfricaWestern AsiaWestern EuropeYemenZaireZimbabweAzores
Immigrants from Peru
Race
Ancestry
AfghanAfricanAlaska NativeAlaskan AthabascanAlbanianAleutAlsatianAmericanApacheArapahoArgentineanArmenianAssyrian/Chaldean/SyriacAustralianAustrianBahamianBangladeshiBarbadianBasqueBelgianBelizeanBermudanBhutaneseBlackfeetBolivianBrazilianBritishBritish West IndianBulgarianBurmeseCajunCambodianCanadianCape VerdeanCarpatho RusynCelticCentral AmericanCentral American IndianCherokeeCheyenneChickasawChileanChineseChippewaChoctawColombianColvilleComancheCosta RicanCreeCreekCroatianCrowCubanCypriotCzechCzechoslovakianDanishDelawareDominicanDutchDutch West IndianEastern EuropeanEcuadorianEgyptianEnglishEstonianEthiopianEuropeanFijianFilipinoFinnishFrenchFrench American IndianFrench CanadianGermanGerman RussianGhanaianGreekGuamanian/ChamorroGuatemalanGuyaneseHaitianHmongHonduranHopiHoumaHungarianIcelanderIndian (Asian)IndonesianInupiatIranianIraqiIrishIroquoisIsraeliItalianJamaicanJapaneseJordanianKenyanKiowaKoreanLaotianLatvianLebaneseLiberianLithuanianLumbeeLuxembourgerMacedonianMalaysianMalteseMarshalleseMenomineeMexicanMexican American IndianMongolianMoroccanNative HawaiianNavajoNepaleseNew ZealanderNicaraguanNigerianNorthern EuropeanNorwegianOkinawanOsageOttawaPaiutePakistaniPalestinianPanamanianParaguayanPennsylvania GermanPeruvianPimaPolishPortuguesePotawatomiPuebloPuerto RicanPuget Sound SalishRomanianRussianSalvadoranSamoanScandinavianScotch-IrishScottishSeminoleSenegaleseSerbianShoshoneSierra LeoneanSiouxSlavicSlovakSloveneSomaliSouth AfricanSouth AmericanSouth American IndianSoviet UnionSpaniardSpanishSpanish AmericanSpanish American IndianSri LankanSubsaharan AfricanSudaneseSwedishSwissSyrianTaiwaneseThaiTlingit-HaidaTohono O'OdhamTonganTrinidadian and TobagonianTsimshianTurkishU.S. Virgin IslanderUgandanUkrainianUruguayanUteVenezuelanVietnameseWelshWest IndianYakamaYaquiYugoslavianYumanYup'ikZimbabwean
Immigration
NonimmigrantsImmigrantsAfghanistanAfricaAlbaniaArgentinaArmeniaAsiaAustraliaAustriaBahamasBangladeshBarbadosBelarusBelgiumBelizeBoliviaBosnia and HerzegovinaBrazilBulgariaBurma/MyanmarCabo VerdeCambodiaCameroonCanadaCaribbeanCentral AmericaChileChinaColombiaCongoCosta RicaCroatiaCubaCzechoslovakiaDenmarkDominicaDominican RepublicEastern AfricaEastern AsiaEastern EuropeEcuadorEgyptEl SalvadorEnglandEritreaEthiopiaEuropeFijiFranceGermanyGhanaGreeceGrenadaGuatemalaGuyanaHaitiHondurasHong KongHungaryIndiaIndonesiaIranIraqIrelandIsraelItalyJamaicaJapanJordanKazakhstanKenyaKoreaKuwaitLaosLatin AmericaLatviaLebanonLiberiaLithuaniaMalaysiaMexicoMicronesiaMiddle AfricaMoldovaMoroccoNepalNetherlandsNicaraguaNigeriaNorth AmericaNorth MacedoniaNorthern AfricaNorthern EuropeNorwayOceaniaPakistanPanamaPeruPhilippinesPolandPortugalRomaniaRussiaSaudi ArabiaScotlandSenegalSerbiaSierra LeoneSingaporeSomaliaSouth AfricaSouth AmericaSouth Central AsiaSouth Eastern AsiaSouthern EuropeSpainSri LankaSt. Vincent and the GrenadinesSudanSwedenSwitzerlandSyriaTaiwanThailandTrinidad and TobagoTurkeyUgandaUkraineUruguayUzbekistanVenezuelaVietnamWest IndiesWestern AfricaWestern AsiaWestern EuropeYemenZaireZimbabweAzores
3rd Grade
Income
Poverty
Unemployment
Labor Participation
Family Structure
Vehicle Availability
Education Level
Disability

3rd Grade Comparison

Arabs

Immigrants from Peru

Fair
Tragic
97.7%
3RD GRADE
40.0/ 100
METRIC RATING
183rd/ 347
METRIC RANK
97.2%
3RD GRADE
0.1/ 100
METRIC RATING
273rd/ 347
METRIC RANK

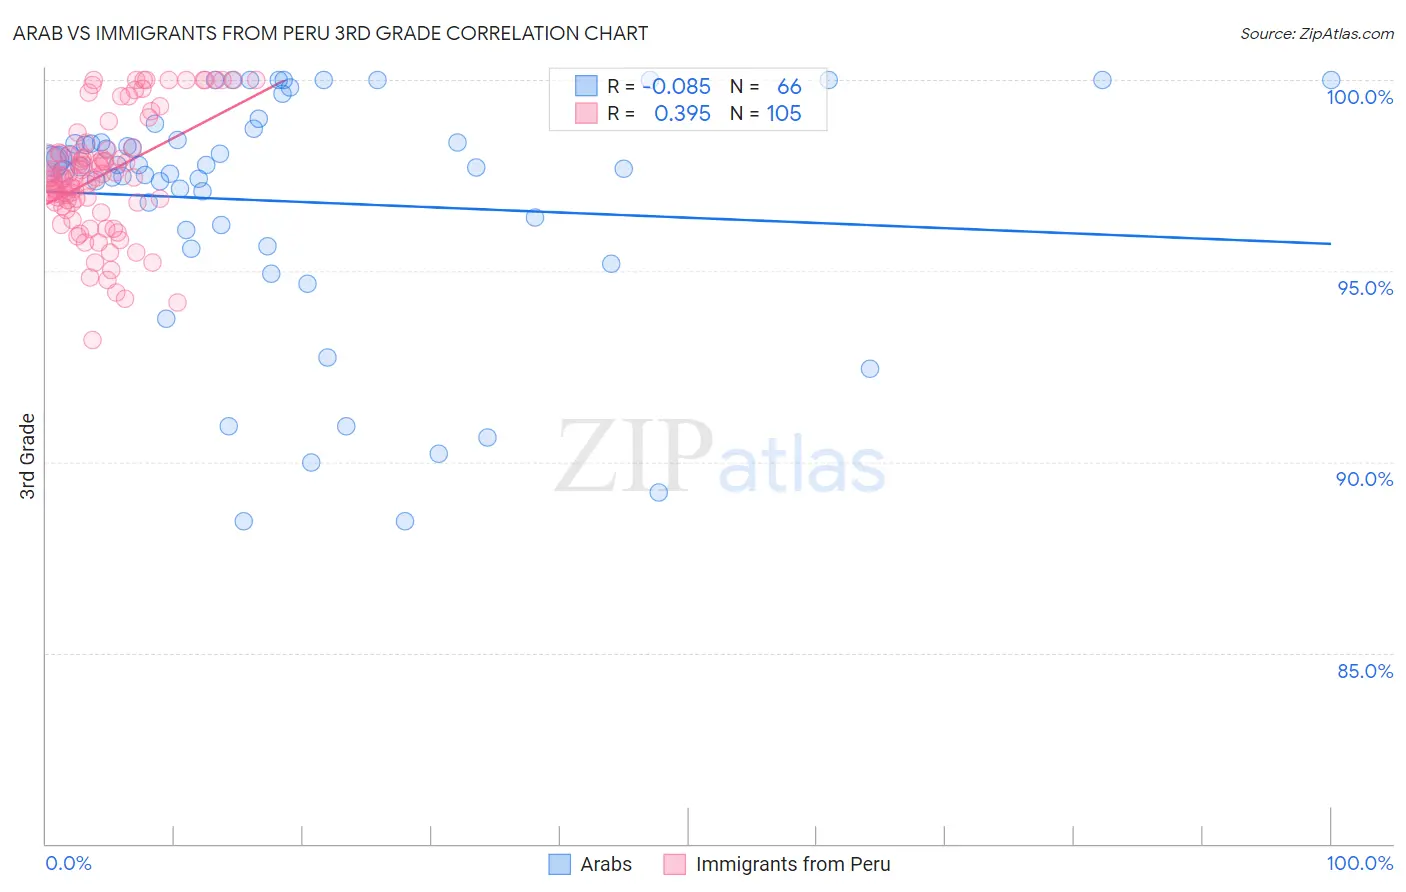
Arab vs Immigrants from Peru 3rd Grade Correlation Chart

The statistical analysis conducted on geographies consisting of 486,872,222 people shows a slight negative correlation between the proportion of Arabs and percentage of population with at least 3rd grade education in the United States with a correlation coefficient (R) of -0.085 and weighted average of 97.7%. Similarly, the statistical analysis conducted on geographies consisting of 328,685,754 people shows a mild positive correlation between the proportion of Immigrants from Peru and percentage of population with at least 3rd grade education in the United States with a correlation coefficient (R) of 0.395 and weighted average of 97.2%, a difference of 0.52%.
Arab vs Immigrants from Peru 3rd Grade

3rd Grade Correlation Summary

MeasurementArabImmigrants from Peru
Minimum88.4%93.2%
Maximum100.0%100.0%
Range11.6%6.8%
Mean96.8%97.5%
Median97.8%97.5%
Interquartile 25% (IQ1)96.1%96.8%
Interquartile 75% (IQ3)98.4%98.1%
Interquartile Range (IQR)2.4%1.3%
Standard Deviation (Sample)3.1%1.5%
Standard Deviation (Population)3.1%1.5%

Similar Demographics by 3rd Grade

Demographics Similar to Arabs by 3rd Grade

In terms of 3rd grade, the demographic groups most similar to Arabs are Argentinean (97.7%, a difference of 0.010%), Immigrants from Kazakhstan (97.7%, a difference of 0.010%), Immigrants from Argentina (97.7%, a difference of 0.010%), Portuguese (97.7%, a difference of 0.010%), and Immigrants from Poland (97.8%, a difference of 0.020%).
DemographicsRating | Rank3rd Grade
Immigrants | Poland
47.1
/100
|
#176
Average
97.8%
Egyptians
46.6
/100
|
#177
Average
97.7%
Immigrants | Brazil
46.4
/100
|
#178
Average
97.7%
Immigrants | Belarus
45.9
/100
|
#179
Average
97.7%
Immigrants | Sri Lanka
45.1
/100
|
#180
Average
97.7%
Immigrants | Venezuela
44.4
/100
|
#181
Average
97.7%
Argentineans
42.9
/100
|
#182
Average
97.7%
Arabs
40.0
/100
|
#183
Fair
97.7%
Immigrants | Kazakhstan
37.4
/100
|
#184
Fair
97.7%
Immigrants | Argentina
37.0
/100
|
#185
Fair
97.7%
Portuguese
36.2
/100
|
#186
Fair
97.7%
Natives/Alaskans
35.2
/100
|
#187
Fair
97.7%
Immigrants | Taiwan
34.2
/100
|
#188
Fair
97.7%
Pakistanis
34.2
/100
|
#189
Fair
97.7%
Panamanians
31.5
/100
|
#190
Fair
97.7%

Demographics Similar to Immigrants from Peru by 3rd Grade

In terms of 3rd grade, the demographic groups most similar to Immigrants from Peru are Puerto Rican (97.2%, a difference of 0.0%), Ghanaian (97.2%, a difference of 0.0%), Immigrants from China (97.2%, a difference of 0.010%), Immigrants from Cameroon (97.2%, a difference of 0.010%), and Immigrants from Uzbekistan (97.2%, a difference of 0.030%).
DemographicsRating | Rank3rd Grade
Yaqui
0.3
/100
|
#266
Tragic
97.3%
Immigrants | Nigeria
0.3
/100
|
#267
Tragic
97.3%
Cubans
0.2
/100
|
#268
Tragic
97.3%
Fijians
0.2
/100
|
#269
Tragic
97.3%
Immigrants | China
0.2
/100
|
#270
Tragic
97.2%
Puerto Ricans
0.2
/100
|
#271
Tragic
97.2%
Ghanaians
0.1
/100
|
#272
Tragic
97.2%
Immigrants | Peru
0.1
/100
|
#273
Tragic
97.2%
Immigrants | Cameroon
0.1
/100
|
#274
Tragic
97.2%
Immigrants | Uzbekistan
0.1
/100
|
#275
Tragic
97.2%
Immigrants | Bolivia
0.1
/100
|
#276
Tragic
97.2%
Trinidadians and Tobagonians
0.1
/100
|
#277
Tragic
97.2%
Immigrants | Western Africa
0.1
/100
|
#278
Tragic
97.2%
Immigrants | Philippines
0.1
/100
|
#279
Tragic
97.2%
Immigrants | Ghana
0.1
/100
|
#280
Tragic
97.2%