Macedonian vs South American 3rd Grade
COMPARE
Macedonian
South American
3rd Grade
3rd Grade Comparison
Macedonians
South Americans
98.1%
3RD GRADE
99.1/ 100
METRIC RATING
80th/ 347
METRIC RANK
97.4%
3RD GRADE
0.9/ 100
METRIC RATING
249th/ 347
METRIC RANK
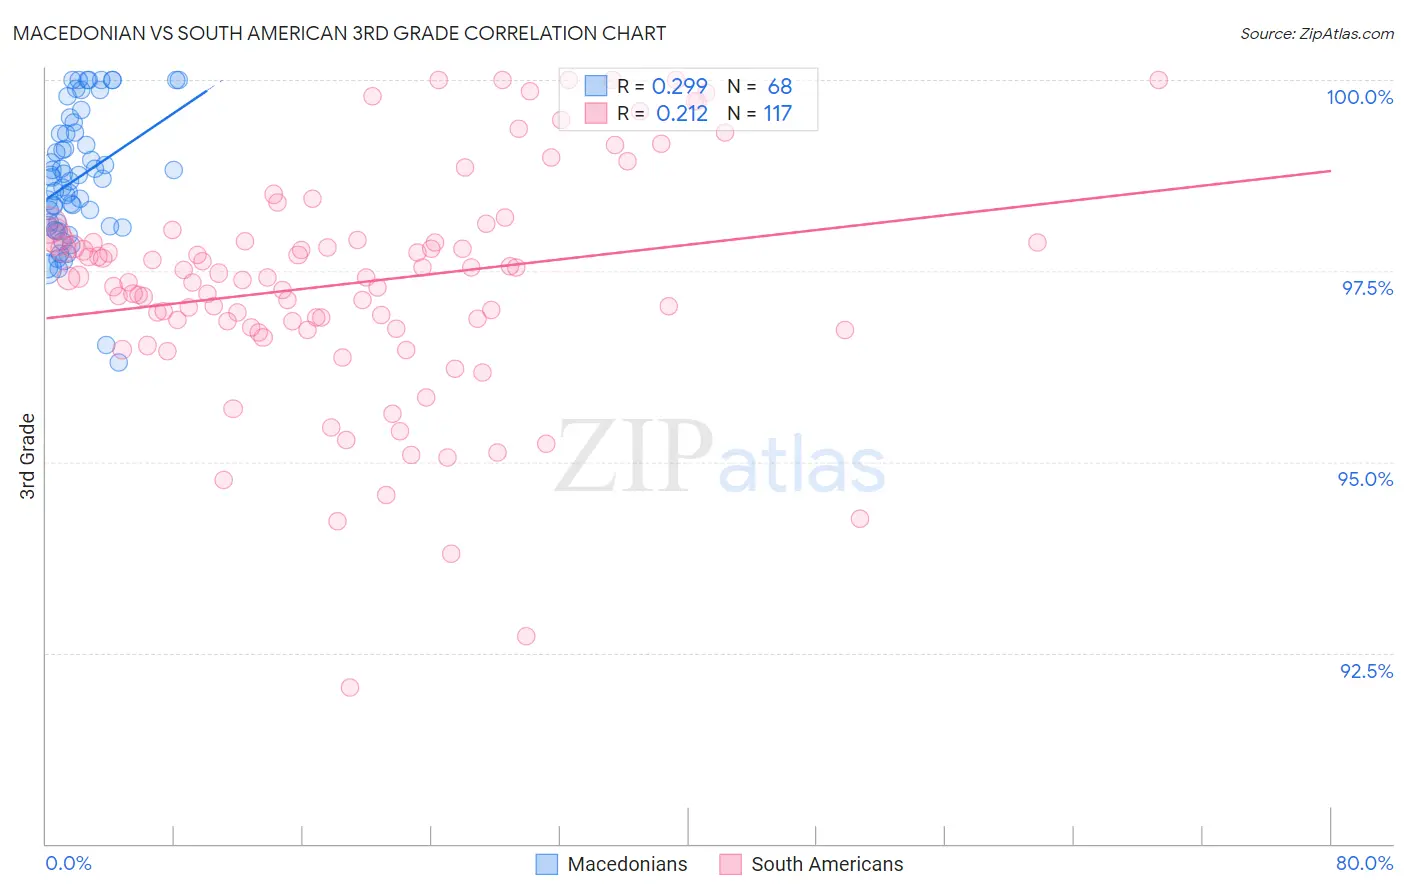
Macedonian vs South American 3rd Grade Correlation Chart
The statistical analysis conducted on geographies consisting of 132,592,860 people shows a weak positive correlation between the proportion of Macedonians and percentage of population with at least 3rd grade education in the United States with a correlation coefficient (R) of 0.299 and weighted average of 98.1%. Similarly, the statistical analysis conducted on geographies consisting of 494,178,447 people shows a weak positive correlation between the proportion of South Americans and percentage of population with at least 3rd grade education in the United States with a correlation coefficient (R) of 0.212 and weighted average of 97.4%, a difference of 0.80%.
3rd Grade Correlation Summary
| Measurement | Macedonian | South American |
| Minimum | 96.3% | 92.1% |
| Maximum | 100.0% | 100.0% |
| Range | 3.7% | 7.9% |
| Mean | 98.7% | 97.3% |
| Median | 98.7% | 97.4% |
| Interquartile 25% (IQ1) | 98.1% | 96.8% |
| Interquartile 75% (IQ3) | 99.3% | 97.9% |
| Interquartile Range (IQR) | 1.2% | 1.2% |
| Standard Deviation (Sample) | 0.86% | 1.5% |
| Standard Deviation (Population) | 0.85% | 1.5% |
Similar Demographics by 3rd Grade
Demographics Similar to Macedonians by 3rd Grade
In terms of 3rd grade, the demographic groups most similar to Macedonians are Immigrants from Belgium (98.1%, a difference of 0.0%), Icelander (98.1%, a difference of 0.0%), Immigrants from Lithuania (98.2%, a difference of 0.010%), Osage (98.2%, a difference of 0.010%), and Shoshone (98.1%, a difference of 0.010%).
| Demographics | Rating | Rank | 3rd Grade |
| Cheyenne | 99.3 /100 | #73 | Exceptional 98.2% |
| Immigrants | Netherlands | 99.3 /100 | #74 | Exceptional 98.2% |
| Cherokee | 99.3 /100 | #75 | Exceptional 98.2% |
| Immigrants | England | 99.2 /100 | #76 | Exceptional 98.2% |
| Immigrants | Lithuania | 99.2 /100 | #77 | Exceptional 98.2% |
| Osage | 99.2 /100 | #78 | Exceptional 98.2% |
| Immigrants | Belgium | 99.1 /100 | #79 | Exceptional 98.1% |
| Macedonians | 99.1 /100 | #80 | Exceptional 98.1% |
| Icelanders | 99.1 /100 | #81 | Exceptional 98.1% |
| Shoshone | 99.0 /100 | #82 | Exceptional 98.1% |
| Ukrainians | 98.9 /100 | #83 | Exceptional 98.1% |
| Immigrants | Sweden | 98.9 /100 | #84 | Exceptional 98.1% |
| Immigrants | Australia | 98.9 /100 | #85 | Exceptional 98.1% |
| Potawatomi | 98.9 /100 | #86 | Exceptional 98.1% |
| Immigrants | Denmark | 98.8 /100 | #87 | Exceptional 98.1% |
Demographics Similar to South Americans by 3rd Grade
In terms of 3rd grade, the demographic groups most similar to South Americans are Immigrants from Eastern Africa (97.4%, a difference of 0.0%), Immigrants from Senegal (97.4%, a difference of 0.010%), Assyrian/Chaldean/Syriac (97.4%, a difference of 0.010%), Immigrants from Middle Africa (97.4%, a difference of 0.010%), and Immigrants from Asia (97.4%, a difference of 0.010%).
| Demographics | Rating | Rank | 3rd Grade |
| Koreans | 1.3 /100 | #242 | Tragic 97.4% |
| Indians (Asian) | 1.3 /100 | #243 | Tragic 97.4% |
| Asians | 1.1 /100 | #244 | Tragic 97.4% |
| Ethiopians | 1.1 /100 | #245 | Tragic 97.4% |
| Immigrants | Senegal | 1.0 /100 | #246 | Tragic 97.4% |
| Assyrians/Chaldeans/Syriacs | 1.0 /100 | #247 | Tragic 97.4% |
| Immigrants | Eastern Africa | 0.9 /100 | #248 | Tragic 97.4% |
| South Americans | 0.9 /100 | #249 | Tragic 97.4% |
| Immigrants | Middle Africa | 0.9 /100 | #250 | Tragic 97.4% |
| Immigrants | Asia | 0.8 /100 | #251 | Tragic 97.4% |
| Peruvians | 0.8 /100 | #252 | Tragic 97.4% |
| Immigrants | Africa | 0.8 /100 | #253 | Tragic 97.4% |
| Jamaicans | 0.7 /100 | #254 | Tragic 97.4% |
| Bolivians | 0.6 /100 | #255 | Tragic 97.3% |
| Immigrants | Congo | 0.6 /100 | #256 | Tragic 97.3% |