Aleut vs South American 3rd Grade
COMPARE
Aleut
South American
3rd Grade
3rd Grade Comparison
Aleuts
South Americans
98.5%
3RD GRADE
100.0/ 100
METRIC RATING
26th/ 347
METRIC RANK
97.4%
3RD GRADE
0.9/ 100
METRIC RATING
249th/ 347
METRIC RANK
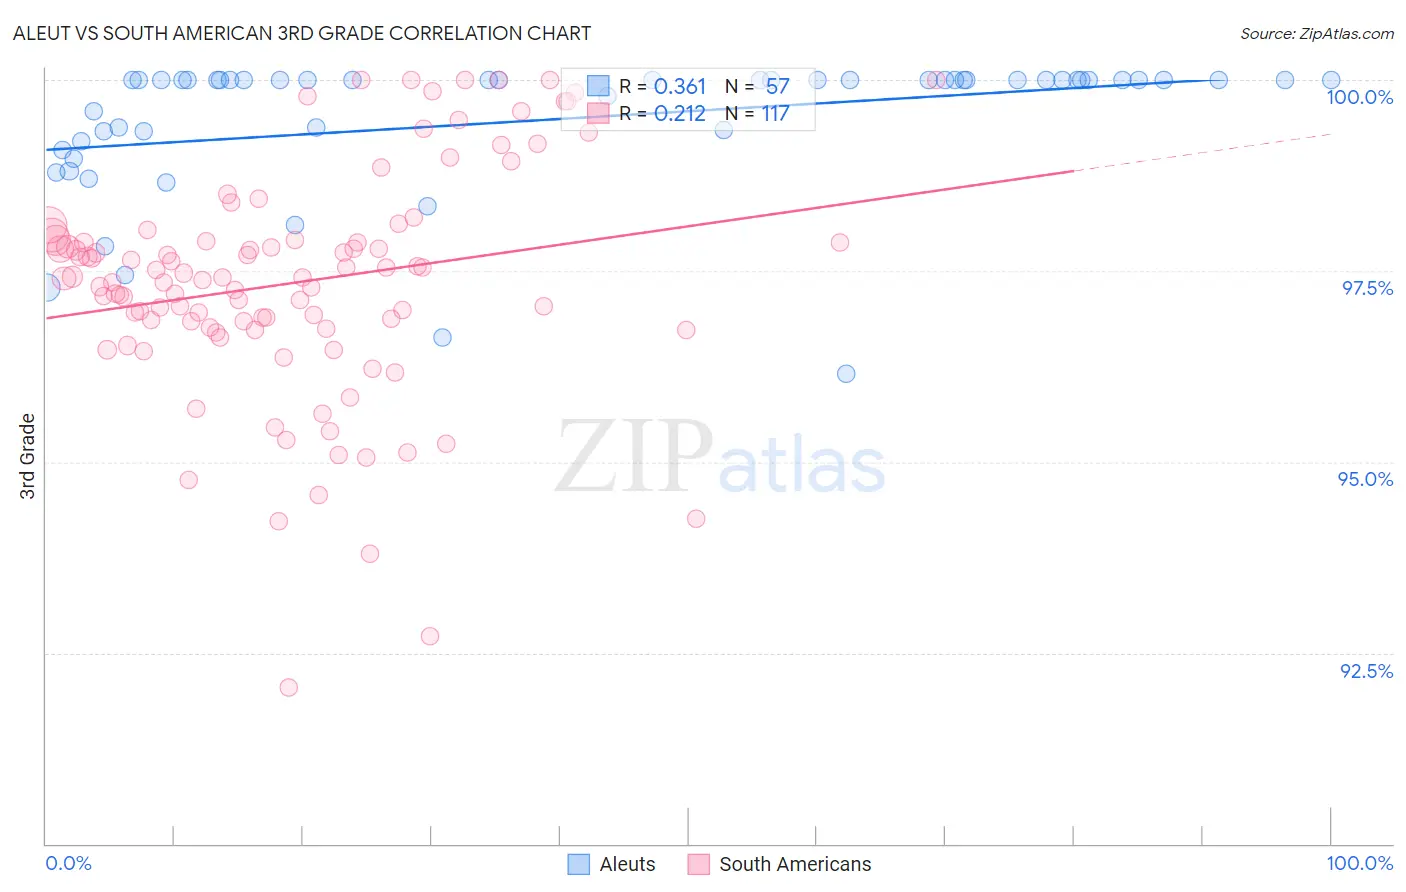
Aleut vs South American 3rd Grade Correlation Chart
The statistical analysis conducted on geographies consisting of 61,781,033 people shows a mild positive correlation between the proportion of Aleuts and percentage of population with at least 3rd grade education in the United States with a correlation coefficient (R) of 0.361 and weighted average of 98.5%. Similarly, the statistical analysis conducted on geographies consisting of 494,178,447 people shows a weak positive correlation between the proportion of South Americans and percentage of population with at least 3rd grade education in the United States with a correlation coefficient (R) of 0.212 and weighted average of 97.4%, a difference of 1.1%.
3rd Grade Correlation Summary
| Measurement | Aleut | South American |
| Minimum | 96.2% | 92.1% |
| Maximum | 100.0% | 100.0% |
| Range | 3.8% | 7.9% |
| Mean | 99.5% | 97.3% |
| Median | 100.0% | 97.4% |
| Interquartile 25% (IQ1) | 99.3% | 96.8% |
| Interquartile 75% (IQ3) | 100.0% | 97.9% |
| Interquartile Range (IQR) | 0.74% | 1.2% |
| Standard Deviation (Sample) | 0.91% | 1.5% |
| Standard Deviation (Population) | 0.91% | 1.5% |
Similar Demographics by 3rd Grade
Demographics Similar to Aleuts by 3rd Grade
In terms of 3rd grade, the demographic groups most similar to Aleuts are Sioux (98.5%, a difference of 0.010%), Danish (98.5%, a difference of 0.010%), Scotch-Irish (98.5%, a difference of 0.010%), Croatian (98.5%, a difference of 0.010%), and Polish (98.5%, a difference of 0.020%).
| Demographics | Rating | Rank | 3rd Grade |
| Poles | 100.0 /100 | #19 | Exceptional 98.5% |
| Pennsylvania Germans | 100.0 /100 | #20 | Exceptional 98.5% |
| Lithuanians | 100.0 /100 | #21 | Exceptional 98.5% |
| Finns | 100.0 /100 | #22 | Exceptional 98.5% |
| Sioux | 100.0 /100 | #23 | Exceptional 98.5% |
| Danes | 100.0 /100 | #24 | Exceptional 98.5% |
| Scotch-Irish | 100.0 /100 | #25 | Exceptional 98.5% |
| Aleuts | 100.0 /100 | #26 | Exceptional 98.5% |
| Croatians | 100.0 /100 | #27 | Exceptional 98.5% |
| French | 100.0 /100 | #28 | Exceptional 98.4% |
| French Canadians | 100.0 /100 | #29 | Exceptional 98.4% |
| Europeans | 100.0 /100 | #30 | Exceptional 98.4% |
| Czechs | 100.0 /100 | #31 | Exceptional 98.4% |
| Scandinavians | 100.0 /100 | #32 | Exceptional 98.4% |
| Chinese | 100.0 /100 | #33 | Exceptional 98.4% |
Demographics Similar to South Americans by 3rd Grade
In terms of 3rd grade, the demographic groups most similar to South Americans are Immigrants from Eastern Africa (97.4%, a difference of 0.0%), Immigrants from Senegal (97.4%, a difference of 0.010%), Assyrian/Chaldean/Syriac (97.4%, a difference of 0.010%), Immigrants from Middle Africa (97.4%, a difference of 0.010%), and Immigrants from Asia (97.4%, a difference of 0.010%).
| Demographics | Rating | Rank | 3rd Grade |
| Koreans | 1.3 /100 | #242 | Tragic 97.4% |
| Indians (Asian) | 1.3 /100 | #243 | Tragic 97.4% |
| Asians | 1.1 /100 | #244 | Tragic 97.4% |
| Ethiopians | 1.1 /100 | #245 | Tragic 97.4% |
| Immigrants | Senegal | 1.0 /100 | #246 | Tragic 97.4% |
| Assyrians/Chaldeans/Syriacs | 1.0 /100 | #247 | Tragic 97.4% |
| Immigrants | Eastern Africa | 0.9 /100 | #248 | Tragic 97.4% |
| South Americans | 0.9 /100 | #249 | Tragic 97.4% |
| Immigrants | Middle Africa | 0.9 /100 | #250 | Tragic 97.4% |
| Immigrants | Asia | 0.8 /100 | #251 | Tragic 97.4% |
| Peruvians | 0.8 /100 | #252 | Tragic 97.4% |
| Immigrants | Africa | 0.8 /100 | #253 | Tragic 97.4% |
| Jamaicans | 0.7 /100 | #254 | Tragic 97.4% |
| Bolivians | 0.6 /100 | #255 | Tragic 97.3% |
| Immigrants | Congo | 0.6 /100 | #256 | Tragic 97.3% |