Icelander vs South American Indian Nursery School
COMPARE
Icelander
South American Indian
Nursery School
Nursery School Comparison
Icelanders
South American Indians
98.3%
NURSERY SCHOOL
99.2/ 100
METRIC RATING
81st/ 347
METRIC RANK
97.8%
NURSERY SCHOOL
8.0/ 100
METRIC RATING
214th/ 347
METRIC RANK
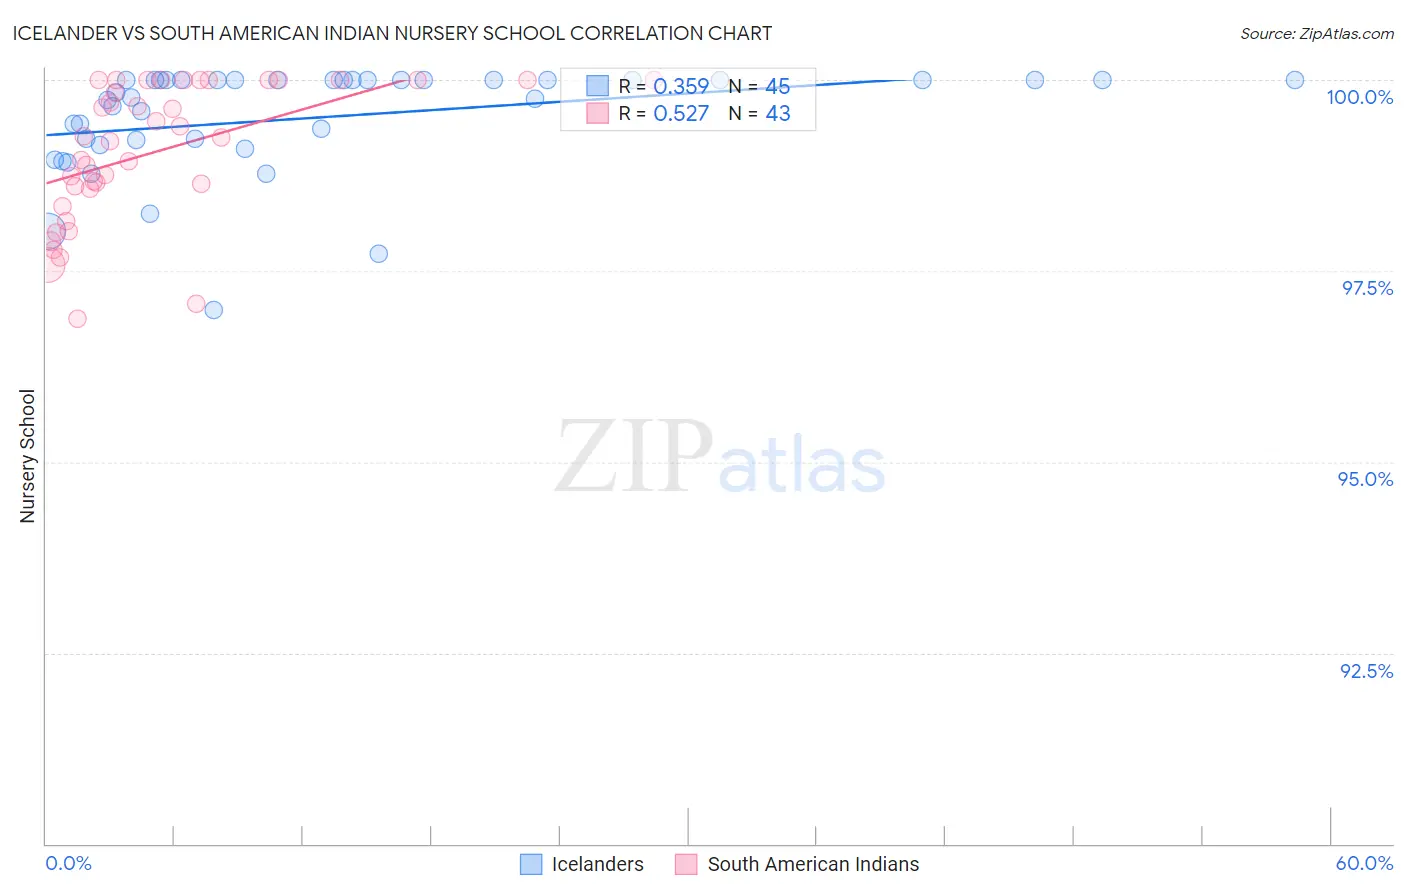
Icelander vs South American Indian Nursery School Correlation Chart
The statistical analysis conducted on geographies consisting of 159,668,748 people shows a mild positive correlation between the proportion of Icelanders and percentage of population with at least nursery school education in the United States with a correlation coefficient (R) of 0.359 and weighted average of 98.3%. Similarly, the statistical analysis conducted on geographies consisting of 164,573,401 people shows a substantial positive correlation between the proportion of South American Indians and percentage of population with at least nursery school education in the United States with a correlation coefficient (R) of 0.527 and weighted average of 97.8%, a difference of 0.55%.
Nursery School Correlation Summary
| Measurement | Icelander | South American Indian |
| Minimum | 97.0% | 96.9% |
| Maximum | 100.0% | 100.0% |
| Range | 3.0% | 3.1% |
| Mean | 99.5% | 99.1% |
| Median | 99.8% | 99.2% |
| Interquartile 25% (IQ1) | 99.2% | 98.6% |
| Interquartile 75% (IQ3) | 100.0% | 100.0% |
| Interquartile Range (IQR) | 0.82% | 1.4% |
| Standard Deviation (Sample) | 0.70% | 0.91% |
| Standard Deviation (Population) | 0.69% | 0.89% |
Similar Demographics by Nursery School
Demographics Similar to Icelanders by Nursery School
In terms of nursery school, the demographic groups most similar to Icelanders are Delaware (98.3%, a difference of 0.0%), Immigrants from Belgium (98.3%, a difference of 0.0%), Shoshone (98.3%, a difference of 0.0%), Potawatomi (98.3%, a difference of 0.0%), and Immigrants from Netherlands (98.4%, a difference of 0.010%).
| Demographics | Rating | Rank | Nursery School |
| Immigrants | Netherlands | 99.4 /100 | #74 | Exceptional 98.4% |
| Cherokee | 99.3 /100 | #75 | Exceptional 98.3% |
| Immigrants | England | 99.3 /100 | #76 | Exceptional 98.3% |
| Immigrants | Lithuania | 99.3 /100 | #77 | Exceptional 98.3% |
| Delaware | 99.3 /100 | #78 | Exceptional 98.3% |
| Immigrants | Belgium | 99.3 /100 | #79 | Exceptional 98.3% |
| Shoshone | 99.3 /100 | #80 | Exceptional 98.3% |
| Icelanders | 99.2 /100 | #81 | Exceptional 98.3% |
| Potawatomi | 99.2 /100 | #82 | Exceptional 98.3% |
| Osage | 99.1 /100 | #83 | Exceptional 98.3% |
| Immigrants | Denmark | 99.1 /100 | #84 | Exceptional 98.3% |
| Immigrants | Sweden | 99.1 /100 | #85 | Exceptional 98.3% |
| Immigrants | Australia | 99.0 /100 | #86 | Exceptional 98.3% |
| Hopi | 98.9 /100 | #87 | Exceptional 98.3% |
| Ukrainians | 98.9 /100 | #88 | Exceptional 98.3% |
Demographics Similar to South American Indians by Nursery School
In terms of nursery school, the demographic groups most similar to South American Indians are Moroccan (97.8%, a difference of 0.0%), Immigrants from Bahamas (97.8%, a difference of 0.010%), Bahamian (97.8%, a difference of 0.010%), Uruguayan (97.8%, a difference of 0.010%), and Immigrants from Oceania (97.8%, a difference of 0.020%).
| Demographics | Rating | Rank | Nursery School |
| Africans | 15.4 /100 | #207 | Poor 97.9% |
| Immigrants | Northern Africa | 11.7 /100 | #208 | Poor 97.8% |
| Costa Ricans | 11.3 /100 | #209 | Poor 97.8% |
| Immigrants | Oceania | 10.2 /100 | #210 | Poor 97.8% |
| Laotians | 9.8 /100 | #211 | Tragic 97.8% |
| Immigrants | Bahamas | 8.6 /100 | #212 | Tragic 97.8% |
| Moroccans | 8.3 /100 | #213 | Tragic 97.8% |
| South American Indians | 8.0 /100 | #214 | Tragic 97.8% |
| Bahamians | 7.4 /100 | #215 | Tragic 97.8% |
| Uruguayans | 7.1 /100 | #216 | Tragic 97.8% |
| Samoans | 6.3 /100 | #217 | Tragic 97.8% |
| Immigrants | Panama | 5.3 /100 | #218 | Tragic 97.8% |
| Immigrants | Morocco | 5.1 /100 | #219 | Tragic 97.8% |
| Immigrants | Zaire | 4.4 /100 | #220 | Tragic 97.8% |
| Tongans | 4.3 /100 | #221 | Tragic 97.8% |