Arab vs Scotch-Irish Professional Degree
COMPARE
Arab
Scotch-Irish
Professional Degree
Professional Degree Comparison
Arabs
Scotch-Irish
5.0%
PROFESSIONAL DEGREE
98.2/ 100
METRIC RATING
104th/ 347
METRIC RANK
4.3%
PROFESSIONAL DEGREE
34.2/ 100
METRIC RATING
186th/ 347
METRIC RANK
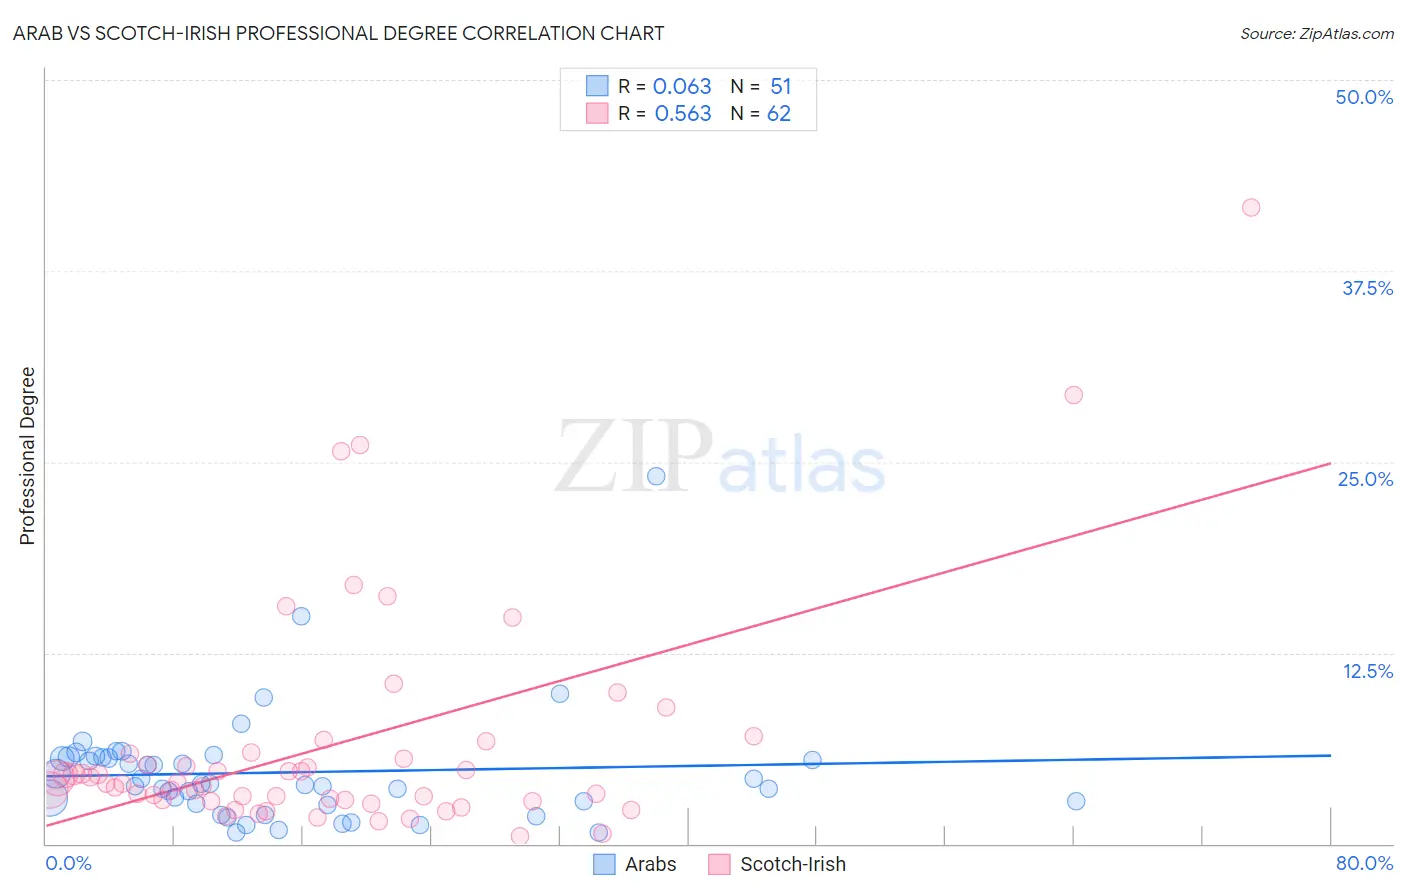
Arab vs Scotch-Irish Professional Degree Correlation Chart
The statistical analysis conducted on geographies consisting of 485,125,544 people shows a slight positive correlation between the proportion of Arabs and percentage of population with at least professional degree education in the United States with a correlation coefficient (R) of 0.063 and weighted average of 5.0%. Similarly, the statistical analysis conducted on geographies consisting of 542,187,635 people shows a substantial positive correlation between the proportion of Scotch-Irish and percentage of population with at least professional degree education in the United States with a correlation coefficient (R) of 0.563 and weighted average of 4.3%, a difference of 17.3%.
Professional Degree Correlation Summary
| Measurement | Arab | Scotch-Irish |
| Minimum | 0.70% | 0.53% |
| Maximum | 24.1% | 41.7% |
| Range | 23.4% | 41.1% |
| Mean | 4.7% | 6.5% |
| Median | 3.9% | 4.0% |
| Interquartile 25% (IQ1) | 2.6% | 2.8% |
| Interquartile 75% (IQ3) | 5.6% | 5.9% |
| Interquartile Range (IQR) | 3.0% | 3.0% |
| Standard Deviation (Sample) | 3.8% | 7.5% |
| Standard Deviation (Population) | 3.7% | 7.4% |
Similar Demographics by Professional Degree
Demographics Similar to Arabs by Professional Degree
In terms of professional degree, the demographic groups most similar to Arabs are Immigrants from Uganda (5.0%, a difference of 0.020%), Immigrants from Ukraine (5.0%, a difference of 0.050%), Maltese (5.0%, a difference of 0.17%), Immigrants from Southern Europe (5.0%, a difference of 0.21%), and British (5.0%, a difference of 0.23%).
| Demographics | Rating | Rank | Professional Degree |
| Syrians | 99.1 /100 | #97 | Exceptional 5.2% |
| Austrians | 99.1 /100 | #98 | Exceptional 5.2% |
| Immigrants | Italy | 99.1 /100 | #99 | Exceptional 5.2% |
| Ugandans | 98.8 /100 | #100 | Exceptional 5.1% |
| Immigrants | Egypt | 98.5 /100 | #101 | Exceptional 5.1% |
| Ukrainians | 98.5 /100 | #102 | Exceptional 5.1% |
| Immigrants | Northern Africa | 98.4 /100 | #103 | Exceptional 5.1% |
| Arabs | 98.2 /100 | #104 | Exceptional 5.0% |
| Immigrants | Uganda | 98.2 /100 | #105 | Exceptional 5.0% |
| Immigrants | Ukraine | 98.2 /100 | #106 | Exceptional 5.0% |
| Maltese | 98.1 /100 | #107 | Exceptional 5.0% |
| Immigrants | Southern Europe | 98.1 /100 | #108 | Exceptional 5.0% |
| British | 98.0 /100 | #109 | Exceptional 5.0% |
| Lebanese | 98.0 /100 | #110 | Exceptional 5.0% |
| Brazilians | 97.4 /100 | #111 | Exceptional 5.0% |
Demographics Similar to Scotch-Irish by Professional Degree
In terms of professional degree, the demographic groups most similar to Scotch-Irish are Immigrants from Cameroon (4.3%, a difference of 0.15%), Welsh (4.3%, a difference of 0.27%), Belgian (4.3%, a difference of 0.32%), Immigrants from Thailand (4.3%, a difference of 0.43%), and Slovak (4.3%, a difference of 0.60%).
| Demographics | Rating | Rank | Professional Degree |
| Immigrants | Kenya | 45.9 /100 | #179 | Average 4.4% |
| Czechs | 44.9 /100 | #180 | Average 4.4% |
| Danes | 43.5 /100 | #181 | Average 4.4% |
| Immigrants | Immigrants | 43.2 /100 | #182 | Average 4.4% |
| Bermudans | 43.1 /100 | #183 | Average 4.4% |
| Belgians | 36.2 /100 | #184 | Fair 4.3% |
| Welsh | 35.8 /100 | #185 | Fair 4.3% |
| Scotch-Irish | 34.2 /100 | #186 | Fair 4.3% |
| Immigrants | Cameroon | 33.3 /100 | #187 | Fair 4.3% |
| Immigrants | Thailand | 31.7 /100 | #188 | Fair 4.3% |
| Slovaks | 30.7 /100 | #189 | Fair 4.3% |
| Immigrants | Poland | 29.2 /100 | #190 | Fair 4.3% |
| Sri Lankans | 29.0 /100 | #191 | Fair 4.3% |
| Ghanaians | 27.3 /100 | #192 | Fair 4.3% |
| French | 27.1 /100 | #193 | Fair 4.2% |